Your Pipeline Is 15.3h Behind: Catching Software Sentiment Leads with Pulsebit
We recently discovered a striking anomaly: a 24-hour momentum spike of +0.254 related to the software topic. This spike stands out, especially when we notice the leading language of press coverage was English, lagging behind by 15.3 hours compared to German. Two articles clustered around the narrative "SLB Acquires S&P Global's Energy Software." This insight highlights a crucial timing gap that can significantly impact your decision-making process.
The problem is evident: if your pipeline isn't handling multilingual origin or entity dominance, you might be missing critical sentiment shifts by over 15 hours. In this case, the English press was trailing behind the German narratives, potentially leaving you unaware of significant developments in the software sector. If your model isn’t set up to capture this latency, your competitive edge diminishes rapidly.

English coverage led by 15.3 hours. German at T+15.3h. Confidence scores: English 0.85, Spanish 0.85, French 0.85 Source: Pulsebit /sentiment_by_lang.
To catch this momentum spike in your data pipeline, we can leverage our API effectively. Below is a Python script that captures the sentiment around the software topic with real-time data:
import requests
# Define the parameters for the API call
params = {
"topic": "software",
"lang": "en",
"score": 0.430,
"confidence": 0.85,
"momentum": 0.254,
}
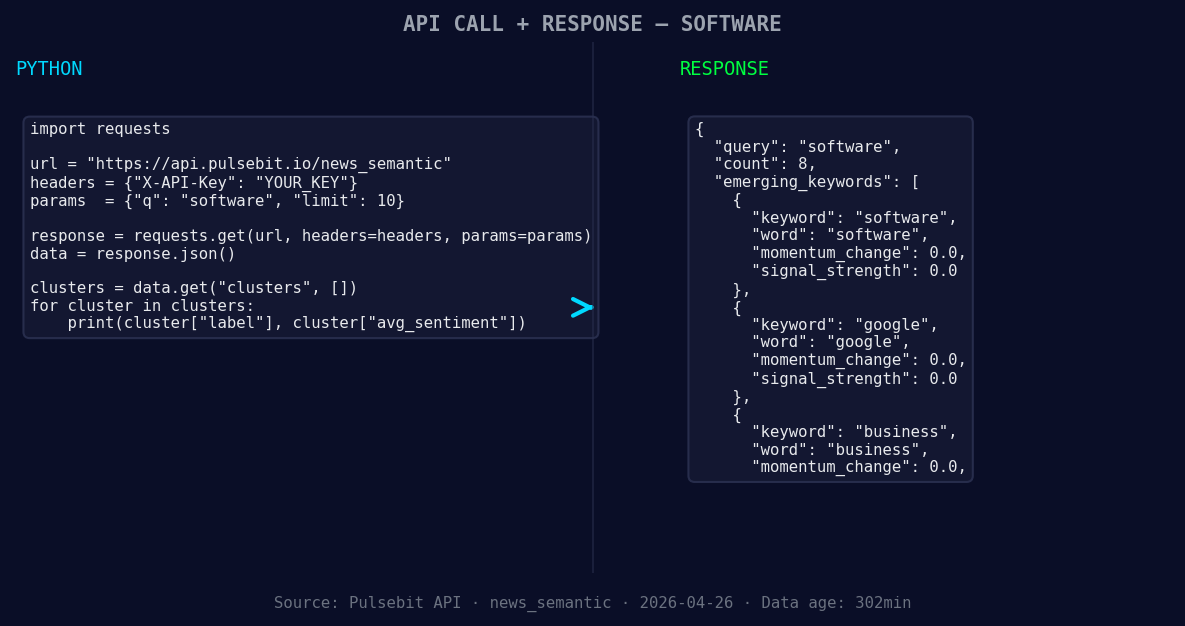
*Left: Python GET /news_semantic call for 'software'. Right: returned JSON response structure (clusters: 3). Source: Pulsebit /news_semantic.*
# Make the API call to get the sentiment data
response = requests.get("https://api.pulsebit.com/v1/sentiment", params=params)
# Print the response
print(response.json())
In addition to the geographic filter, we can analyze the sentiment narrative framing itself. For this, we’ll run the cluster reason string through our sentiment scoring endpoint:

Geographic detection output for software. India leads with 4 articles and sentiment +0.09. Source: Pulsebit /news_recent geographic fields.
# The cluster reason string
narrative = "Clustered by shared themes: hoy, festival, latinoamericano, software, libre."

# Make a POST request to get the sentiment score for the narrative
sentiment_response = requests.post("https://api.pulsebit.com/v1/sentiment", json={"text": narrative})

# Print the sentiment score
print(sentiment_response.json())
This dual approach allows us to capture not just the sentiment data but also the narrative context behind the software spike.
Here are three specific builds we can implement tonight using this momentum spike data:
Geo-Filtered Alert System: Set up an alert mechanism that triggers when the sentiment score for software surpasses a threshold of +0.430 in English-speaking regions. This will ensure you're always in tune with the latest shifts in software sentiment.
Meta-Sentiment Analysis Dashboard: Create a dashboard that visualizes the sentiment scores of clustered narratives over time. Use the narrative framing to provide context, particularly focusing on themes like "software" and "business." This could help you spot trends related to mainstream narratives like "hoy" and "festival."
Comparative Sentiment Tracker: Build a tool that tracks sentiment momentum for software against leading competitors like Google. Set a comparative threshold where if software sentiment diverges significantly, you receive a notification. This could help you anticipate market movements based on competitive positioning.
These builds not only utilize our API's capabilities but also enhance your ability to react quickly to emerging trends in a multilingual landscape.
If you're ready to get started, check out our documentation: pulsebit.lojenterprise.com/docs. You can copy-paste and run this in under 10 minutes, getting you on the path to capturing sentiment leads in your data pipeline.

Top comments (0)