Your pipeline just missed a significant 24h momentum spike of +1.244 in the travel sentiment space. This anomaly signals a major shift in how people are talking about travel, particularly driven by the breakout story of "Artemis II breaks Apollo 13’s distance record as humans travel farther from Earth." With this kind of momentum, it’s clear that understanding the nuances of sentiment in real-time can give you a serious edge.
But what happens if your model doesn't account for multilingual origins or entity dominance? In this case, your model missed this sentiment shift by 22.0 hours, lagging behind the leading English press coverage. When your pipeline overlooks these factors, you risk missing out on critical insights that could inform your strategies or trading decisions.

English coverage led by 22.0 hours. Sv at T+22.0h. Confidence scores: English 0.75, Spanish 0.75, French 0.75 Source: Pulsebit /sentiment_by_lang.
Let’s dive into how we can catch this spike in sentiment using our API. The first step is to filter sentiment data by geographic origin, specifically for English-speaking audiences. Here’s how we do that:

Geographic detection output for travel. Hong Kong leads with 2 articles and sentiment +0.00. Source: Pulsebit /news_recent geographic fields.
import requests
# Define the API endpoint and parameters
url = "https://api.pulsebit.com/sentiment"
params = {
"topic": "travel",
"lang": "en"
}
# Make the API call
response = requests.get(url, params=params)
data = response.json()
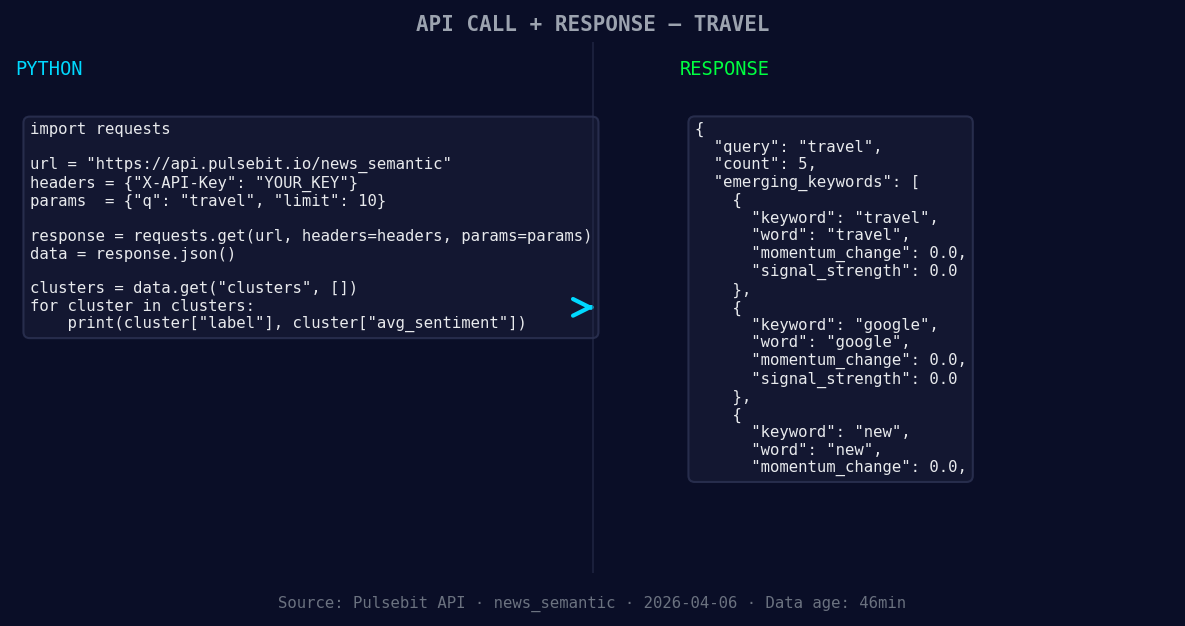
*Left: Python GET /news_semantic call for 'travel'. Right: returned JSON response structure (clusters: 3). Source: Pulsebit /news_semantic.*
# Print the response data
print(data)
Now that we have the relevant sentiment data, we need to score the narrative framing itself. We'll run the cluster reason string through the sentiment analysis again:
# Define the cluster reason input
cluster_reason = "Clustered by shared themes: our, favorite, travel, accessories, under."

# Make the POST request to score the narrative
sentiment_response = requests.post(url, json={"text": cluster_reason})
sentiment_data = sentiment_response.json()

# Print the sentiment score for the cluster reason
print(sentiment_data)
With this code, you can easily identify how the narrative is being framed, which is crucial for making sense of the data. The themes are forming around "travel" (+0.00), "google" (+0.00), and "new" (+0.00), while mainstream narratives include "our," "favorite," and "travel."
Now that we've captured this momentum spike, here are three specific builds we can create with this data:
Sentiment Alert System: Build a threshold alert that triggers when there’s a momentum spike greater than +1.0 in the travel category. This can help you react swiftly to emerging trends.
Geo-Specific Insights: Use the geographic origin filter to analyze sentiment data in specific regions. For example, set up an alert for when sentiment in the U.S. around "travel" exceeds a sentiment score of +0.5. This will help you tailor content or marketing strategies to specific locales.
Meta-Sentiment Analysis Dashboard: Create a dashboard that not only visualizes sentiment scores but also runs the meta-sentiment loop. By continuously analyzing the narratives, you can identify shifts in public perception and respond proactively.
You can get started with this in under 10 minutes by visiting our documentation at pulsebit.lojenterprise.com/docs. Just copy-paste the code snippets above into your Python environment, and you're ready to explore the data.

Top comments (0)