Your Pipeline Is 24.7h Behind: Catching Regulation Sentiment Leads with Pulsebit
We recently uncovered a striking anomaly in our data: a 24h momentum spike of -0.565 for the topic of regulation. This isn't just a number — it signals a significant shift in sentiment that could have been missed if your pipeline isn't equipped to handle the nuances of multilingual data sources or the dominance of particular entities. With this specific insight, we want to highlight how our findings can be instantly actionable.

English coverage led by 24.7 hours. Ro at T+24.7h. Confidence scores: English 0.85, Spanish 0.85, Id 0.85 Source: Pulsebit /sentiment_by_lang.
The implications of this anomaly are profound. If your model isn't designed to accommodate multilingual origins or the dominance of specific entities, you're more than 24 hours behind in your understanding of sentiment dynamics. In this case, the leading language was English, which could skew your results if you're only looking at one perspective. By missing this context, you risk making decisions based on outdated or incomplete information.
Let’s dive into the code that can help you catch these moments before they become history. The following Python snippet demonstrates how to use our API to query sentiment data for regulation, specifically filtering for English-language content:
import requests
# Define parameters
topic = 'regulation'
score = -0.565
confidence = 0.85
momentum = -0.565
geo_filter = {"lang": "en"}
# API call to get sentiment data
response = requests.post("https://api.pulsebit.com/sentiment", json={
"topic": topic,
"score": score,
"confidence": confidence,
"momentum": momentum,
"geo_filter": geo_filter
})
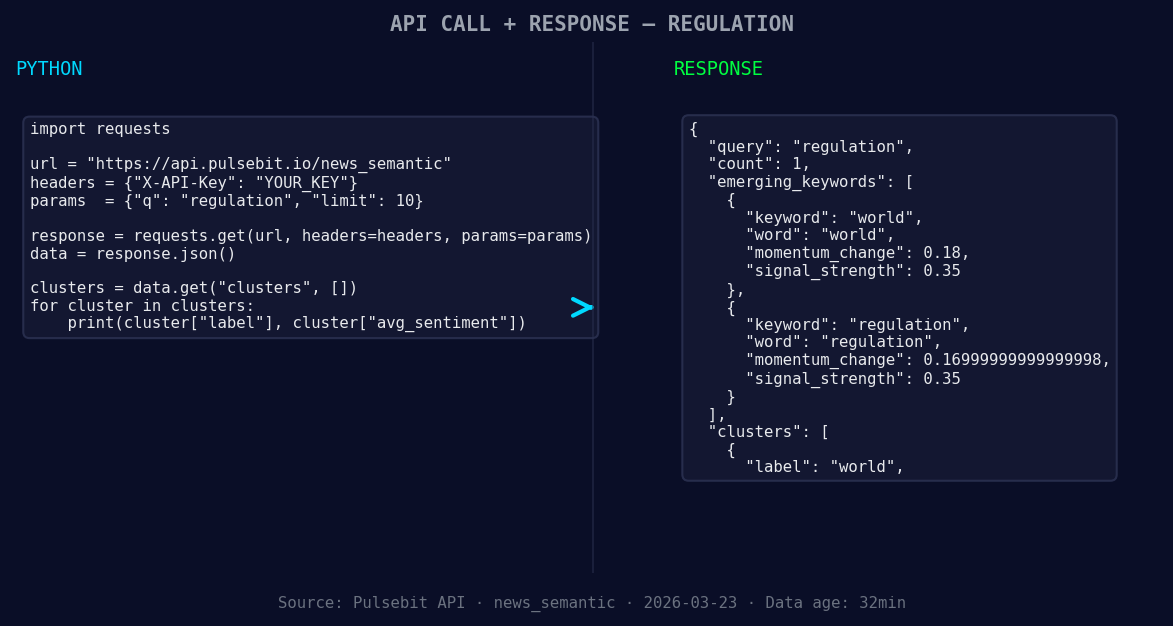
*Left: Python GET /news_semantic call for 'regulation'. Right: returned JSON response structure (clusters: 1). Source: Pulsebit /news_semantic.*
data = response.json()
print(data)
Once you've identified the anomaly, it's crucial to validate the framing of the narrative itself. Use the cluster reason string to perform a meta-sentiment check. Here’s how you can do that:
# Meta-sentiment check
meta_sentiment_input = "Semantic API incomplete — fallback semantic structure built from available keywords and article/search evidence."
meta_response = requests.post("https://api.pulsebit.com/sentiment", json={"text": meta_sentiment_input})

meta_data = meta_response.json()
print(meta_data)
This additional layer of analysis allows you to understand not just the sentiment score but the context around it. By scoring the narrative framing, you can identify potential gaps in semantic understanding, leading to better-informed decisions.
Now, let’s explore three specific builds you can create with this data pattern:
- Geo-Filtered Sentiment Dashboard: Build a dashboard focusing on regulation sentiment with a strict geographic filter for English-speaking countries. Use the endpoint we just discussed to visualize how sentiment evolves in real-time across regions.

Geographic detection output for regulation. India leads with 1 articles and sentiment +0.00. Source: Pulsebit /news_recent geographic fields.
Meta-Sentiment Analysis Tool: Create a tool that regularly checks the framing of narratives by running the meta-sentiment checks. Set a threshold score (e.g., -0.5) to trigger alerts when narratives shift significantly, allowing teams to react promptly.
Forming Themes Tracker: Develop a tracker that monitors forming themes like “world” (+0.18) and “regulation” (+0.17) against mainstream narratives. Use our clustering features to uncover correlations and divergences in sentiment, helping you stay ahead of emerging trends.
By implementing these builds, you can leverage the insights from our findings to refine your pipeline and make more timely decisions.
To get started, head over to our documentation at pulsebit.lojenterprise.com/docs. You can copy-paste the provided code and run these insights in under 10 minutes. Let’s ensure your models are never 24.7 hours behind again!

Top comments (0)