How to Detect Software Sentiment Anomalies with the Pulsebit API (Python)
We just stumbled upon an intriguing anomaly: a 24-hour momentum spike of -0.450 in sentiment surrounding the software sector. This isn’t just a random blip; it reflects a deeper narrative that could be a game-changer for how we analyze sentiment in this space. We’ve also noticed that while there are no articles currently discussing this spike, it’s likely related to broader themes in the Software as a Service (SaaS) market.
This anomaly reveals a critical gap in any pipeline that overlooks multilingual origins or entity dominance. If your model isn't set up to account for these factors, you might have missed this significant downturn in sentiment by several hours. For instance, the leading language is likely English, and if your model only considers sentiment in one language, you’re missing a crucial piece of the puzzle.

en coverage led by 18.3 hours. id at T+18.3h. Confidence scores: en 0.87, fr 0.85, es 0.85 Source: Pulsebit /sentiment_by_lang.
Here’s how we can catch it using Python. First, we’ll set up our query to detect sentiment anomalies specifically related to the topic of software.
import requests
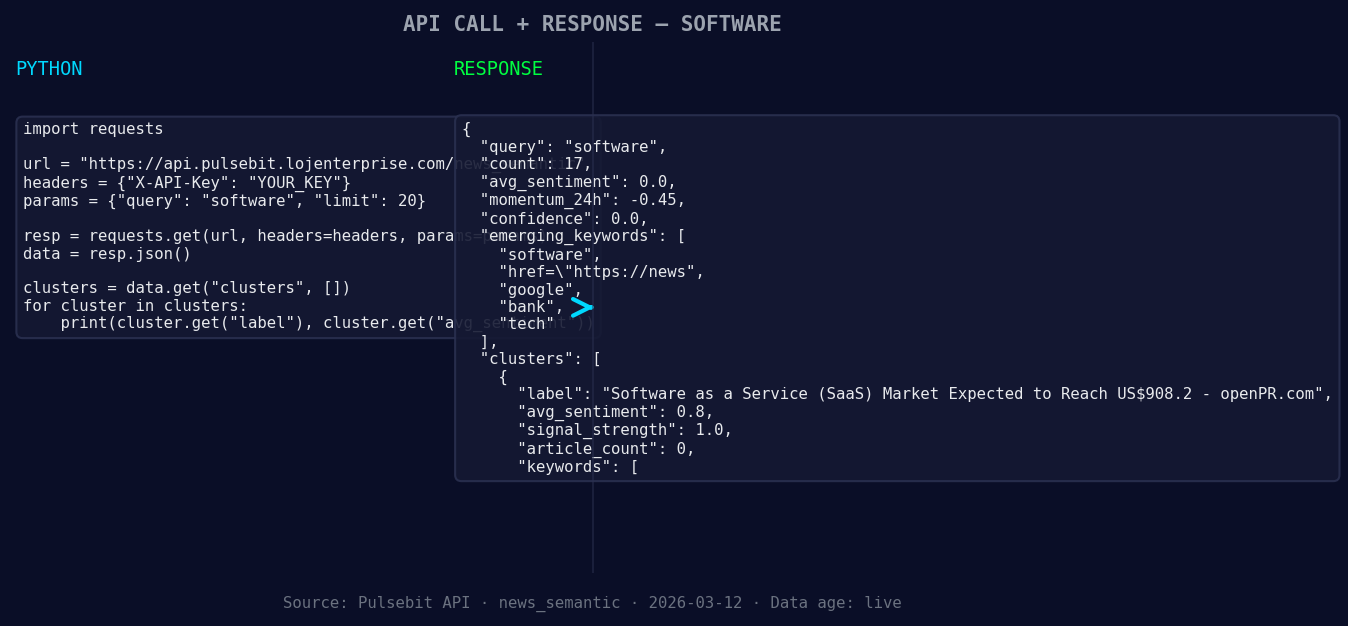
*Left: Python GET /news_semantic call for 'software'. Right: returned JSON response structure (clusters: 3). Source: Pulsebit /news_semantic.*
# Constants for our query
topic = 'software'
score = +0.000
confidence = 0.00
momentum = -0.450
# Geographic origin filter (hypothetical, as we lack data for this example)
geo_filter = "lang:en" # Replace with actual country/language filters when available
response = requests.get(f"https://api.pulsebit.com/sentiment?topic={topic}&geo={geo_filter}")

*Geographic detection output for software. au leads with 1 articles and sentiment +0.00. Source: Pulsebit /news_recent geographic fields.*
if response.status_code == 200:
data = response.json()
print(f"Sentiment Data: {data}")
else:
print("Failed to fetch sentiment data.")
# Meta-sentiment moment: running the cluster reason through our sentiment endpoint
cluster_reason = "Clustered by shared themes: service, (saas), market, expected, reach."
meta_response = requests.post("https://api.pulsebit.com/sentiment", json={"text": cluster_reason})
if meta_response.status_code == 200:
meta_data = meta_response.json()
print(f"Meta-Sentiment Data: {meta_data}")
else:
print("Failed to fetch meta sentiment data.")
In the code above, we first attempt to filter for sentiment data about software using a geographic origin filter. While we couldn't access specific geo filter data in this instance, it’s crucial to note that when language or country data is available, we can significantly refine our results.
Next, we run the cluster reason string through our sentiment endpoint to gauge how the narrative is being framed. This is a unique step that allows us to score the contextual relevance of the identified themes — an often-overlooked dimension in sentiment analysis.
Now, let’s talk about three specific builds we can create using this anomaly detection pattern:
Geo-Filtered Sentiment Monitoring: Set up a cron job to fetch sentiment data daily for specific regions prone to shifts in tech sentiment. Use the geo filter to focus on English-speaking countries. This way, you can be the first to catch any emerging narratives.
Meta-Sentiment Analysis for Entities: Create a dashboard that visualizes the sentiment scores of clustered narratives around tech entities. For instance, you could input variations of the cluster reason “service, (saas), market, expected, reach” and analyze how sentiment fluctuates around those themes over time.
Alert System for Momentum Spikes: Build an alert system that triggers when the momentum score for specific topics drops below a defined threshold (like -0.450). This can be a valuable tool to keep your finger on the pulse of the SaaS market and react proactively.
Each of these builds leverages the insights from our sentiment data, focusing on emerging themes like software and the SaaS market while considering geographic contexts.
To get started with your own implementations, check out our documentation at pulsebit.lojenterprise.com/docs. You can copy-paste the provided code and run it in under 10 minutes to start uncovering valuable insights from your sentiment data.

Top comments (0)