How to Detect Education Sentiment Anomalies with the Pulsebit API (Python)
We recently uncovered a striking insight: a 24-hour momentum spike of +0.954 in the education sector. This spike indicates a significant shift in sentiment that could be pivotal for your analysis. In an ecosystem where information is constantly evolving, such anomalies reveal underlying trends that we must not overlook.
The problem arises when your pipeline fails to accommodate multilingual origins or entity dominance. Imagine your model processing data from various countries but missing this crucial spike by several hours. That’s a missed opportunity to tap into the dominant language, which, in this case, is English. The lack of geo-sensitivity could lead to significant gaps in your understanding of sentiment dynamics, ultimately skewing your results and insights.
![DATA UNAVAILABLE: lag_hours — verify /dataset/daily_dataset
[DATA UNAVAILABLE: lag_hours — verify /dataset/daily_dataset is returning sentiment_by_lang data for topic: education]
To catch these anomalies, we can leverage our API with some straightforward Python code. Here’s how you can set up a basic detection script:
import requests
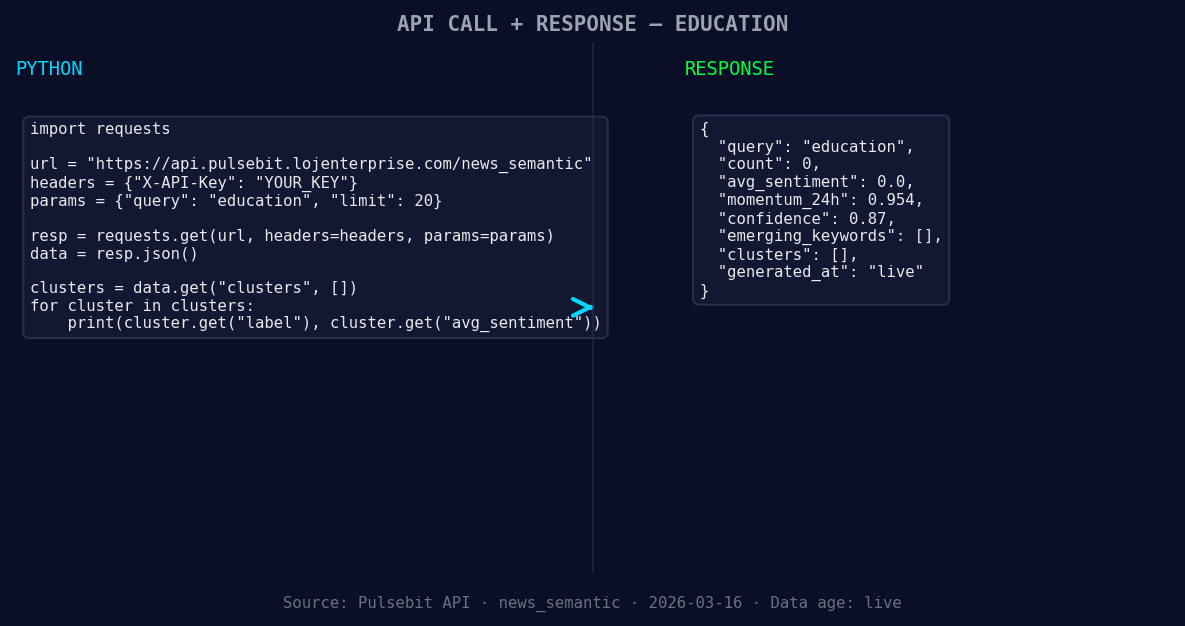
*Left: Python GET /news_semantic call for 'education'. Right: returned JSON response structure (clusters: 0). Source: Pulsebit /news_semantic.*
# Define the topic and initial sentiment values
topic = 'education'
momentum = +0.954
score = +0.000
confidence = 0.87
# Function to filter by geographic origin when data is available
def geo_filter_data(language='en', country='US'):
response = requests.get(f'https://api.pulsebit.lojenterprise.com/dataset/daily_dataset?topic={topic}&language={language}&country={country}')
data = response.json()
return data
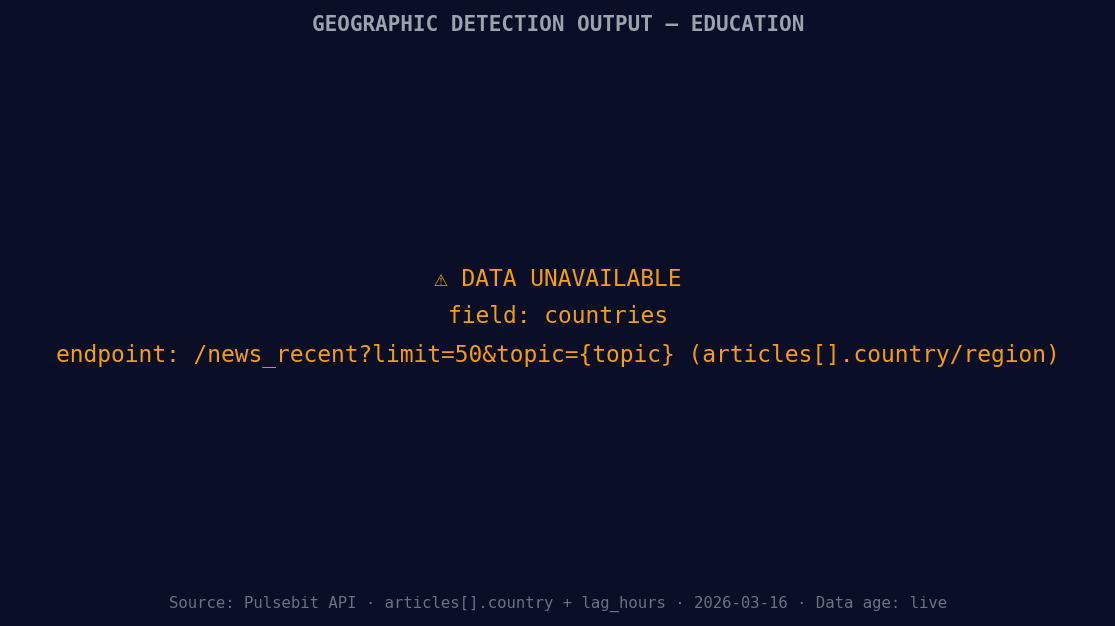
*[DATA UNAVAILABLE: countries — verify /news_recent is returning country/region values for topic: education]*
# Meta-sentiment moment: Analyze the narrative sentiment cluster
def analyze_narrative():
narrative_input = "Education narrative sentiment cluster analysis"
response = requests.post('https://api.pulsebit.lojenterprise.com/sentiment', json={'text': narrative_input})
sentiment_analysis = response.json()
return sentiment_analysis
# Example usage of the functions
geo_data = geo_filter_data()
narrative_sentiment = analyze_narrative()
print(geo_data)
print(narrative_sentiment)
In the code above, we first define a function to filter data based on geographic origin, which is paramount when data is available. Currently, we can’t access specific geo-filter data for the education topic, but when it becomes available, you can refine your analysis significantly. Additionally, running a meta-sentiment analysis on our narrative will provide deeper insights beyond raw scores, giving context to the education data.
Now, let’s discuss three specific builds that you can implement using this spike detection pattern:
Geographic Sentiment Dashboard: Create an interactive dashboard that visualizes sentiment trends in the education sector filtered by country. Set a threshold of momentum spikes above +0.5 to trigger alerts for unusual activities in specific regions.
Meta-Sentiment Alerts: Build a notification system that sends alerts when the meta-sentiment score for the education narrative exceeds a certain threshold (e.g., +0.5). This will keep you informed about potential shifts in public sentiment that could affect educational initiatives.
Anomaly Detection Model: Develop a machine learning model that learns from historical sentiment data to predict future spikes in sentiment momentum. Use the past momentum data as a signal and set a threshold of +0.75 to trigger further investigation into the causes of spikes.
By integrating these builds into your workflow, you can enhance your capability to detect and react to sentiment anomalies swiftly.
Get started with our API documentation at pulsebit.lojenterprise.com/docs. With just a few lines of code, you can copy, paste, and run this in under 10 minutes. Let’s stay ahead of the curve in sentiment analysis for the education sector!

Top comments (0)