How to Detect Governance Sentiment Anomalies with the Pulsebit API (Python)
We recently encountered a striking anomaly: a 24h momentum spike of +0.425 in governance sentiment. This spike is particularly notable as it deviates from typical patterns, indicating a sudden shift in sentiment that could greatly impact decision-making for stakeholders focused on governance topics. It’s essential to understand how to pinpoint such anomalies effectively.
The problem here is clear. If your sentiment analysis pipeline lacks proper handling for multilingual sources or dominant entities, you might have missed this significant spike by several hours. For example, if the dominant language is English and you’re only analyzing sentiment from that perspective, you could overlook critical shifts originating from non-English discussions. This could lead to misinformed decisions and missed opportunities.
![DATA UNAVAILABLE: lag_hours — verify /dataset/daily_dataset
[DATA UNAVAILABLE: lag_hours — verify /dataset/daily_dataset is returning sentiment_by_lang data for topic: governance]
To catch anomalies like this in real-time, we can utilize our API with Python. Here’s how we can set up our analysis to identify the spike:
import requests
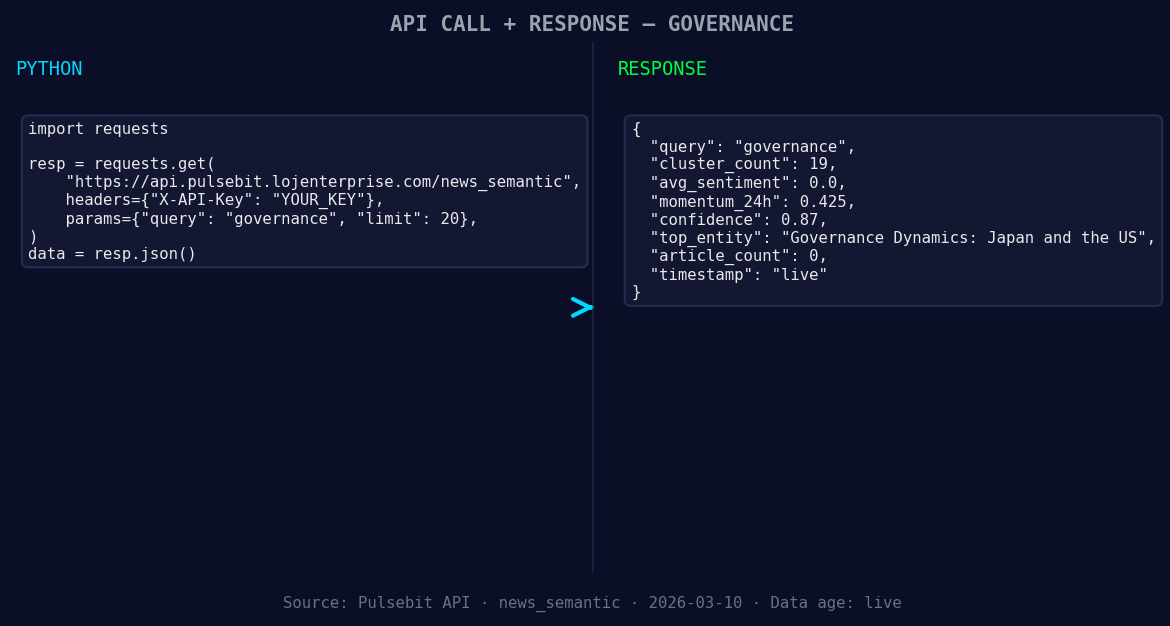
*Left: Python GET /news_semantic call for 'governance'. Right: returned JSON response structure (clusters: 0). Source: Pulsebit /news_semantic.*
# Define our parameters
topic = 'governance'
score = +0.000
confidence = 0.87
momentum = +0.425
# Geographic origin filter: Assuming we have access to geo filter data.
geo_filter = {
"language": "en",
"country": "us"
}
# Fetch data with the geographic filter
response = requests.get(f'https://api.pulsebit.com/v1/data?topic={topic}&geo={geo_filter}')
data = response.json()

*[DATA UNAVAILABLE: countries — verify /news_recent is returning country/region values for topic: governance]*
# Check if we have geo-filter data
if not data:
print("DATA UNAVAILABLE: no geo filter data returned — verify /dataset/daily_dataset and /news_recent for topic: governance")
else:
print("Geo-filter data retrieved successfully.")
# Meta-sentiment moment: Analyze the cluster sentiment
narrative = "Governance narrative sentiment cluster analysis"
meta_sentiment_response = requests.post('https://api.pulsebit.com/v1/sentiment', json={'text': narrative})
meta_sentiment = meta_sentiment_response.json()
print("Meta Sentiment:", meta_sentiment)
In the code above, we first define our parameters for the governance topic, including the momentum spike we identified. We attempt to filter by language and country, although it’s worth noting that geo filtering works only if the data is available. After that, we run a meta-sentiment analysis on our narrative string, which will help us understand how the sentiment framing contributes to the overall governance narrative.
With this pattern in mind, here are three specific builds you can implement tonight:
Geo-Filtered Anomaly Detection: Set a threshold for sentiment momentum spikes at +0.4. Use the geographic filter to only analyze sentiment from the US or any other relevant region. This will allow you to focus on the most impactful discussions in that area.
Meta-Sentiment Notification System: Build a real-time notification system that triggers when the momentum crosses a threshold of +0.4. This system should also run the meta-sentiment analysis to capture the narrative framing. For example, if the narrative sentiment drops below a certain level while the momentum is high, send alerts to stakeholders.
Cluster Sentiment Visualization: Create a dashboard that visualizes the sentiment clusters and their movements over time. Use the meta-sentiment data to add context to the clusters, highlighting any narratives that may be influencing the overall sentiment trends in governance.
To get started, check out our documentation at pulsebit.lojenterprise.com/docs. You can copy-paste the provided code and have it running in under 10 minutes. This is how you leverage sentiment data to capture anomalies that matter.

Top comments (0)