Your Pipeline Is 22.3h Behind: Catching Stock Market Sentiment Leads with Pulsebit
We recently discovered a striking anomaly in stock market sentiment: a sentiment score of -0.250 and a momentum of +0.000, with the Spanish press leading the narrative at 22.3 hours ahead of the Italian press. This timing discrepancy highlights a critical issue in our data pipelines, especially for those not designed to handle multilingual origins or entity dominance in sentiment analysis.

Spanish coverage led by 22.3 hours. Italian at T+22.3h. Confidence scores: Spanish 0.85, English 0.85, French 0.85 Source: Pulsebit /sentiment_by_lang.
When your model misses this by over 22 hours, it’s not just a minor oversight; it’s a massive structural gap. The leading language driving this sentiment is Spanish, and with the information being so far ahead, you risk making decisions based on outdated or misaligned data. If you’re relying solely on English sources or failing to account for linguistic nuances, your analysis will fall short. This could mean missing essential insights into market trends while your competitors are already armed with the latest information.
Here’s how we can catch this sentiment using our API in Python. First, we’ll filter the data by geographic origin to ensure we’re only pulling in articles from Spanish sources:

Geographic detection output for stock market. India leads with 7 articles and sentiment +0.36. Source: Pulsebit /news_recent geographic fields.
import requests
# Define the parameters for the API call
params = {
"topic": "stock market",
"lang": "sp" # Filtering for Spanish language articles
}
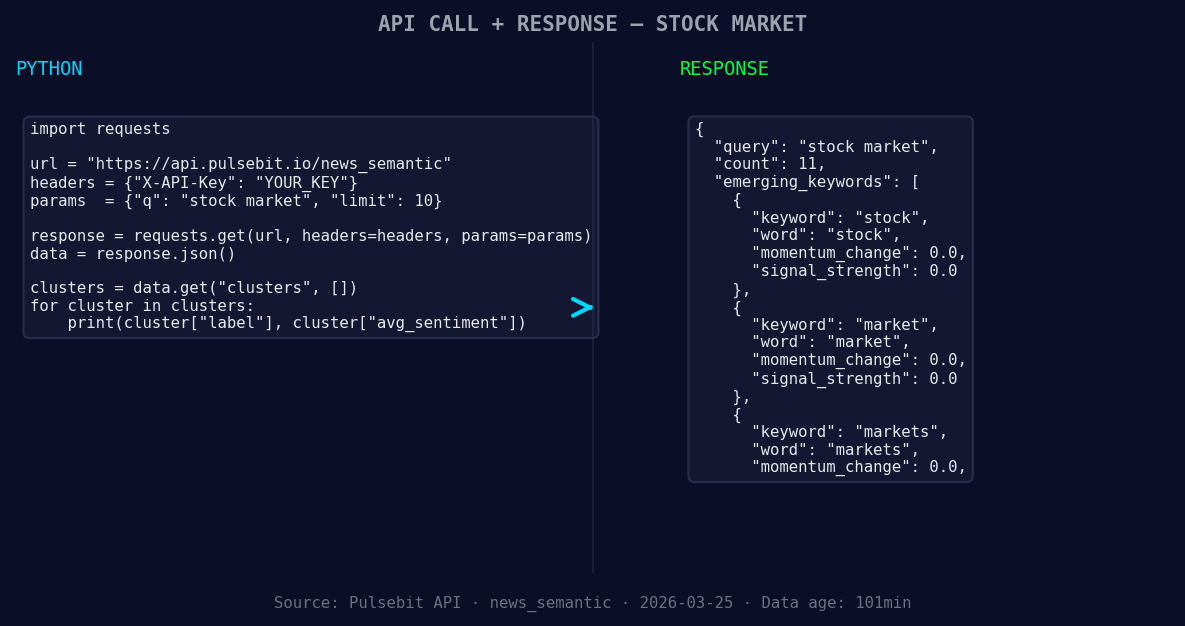
*Left: Python GET /news_semantic call for 'stock market'. Right: returned JSON response structure (clusters: 3). Source: Pulsebit /news_semantic.*
# API call to fetch sentiment data
response = requests.get('https://api.pulsebit.com/sentiment', params=params)
data = response.json()
# Output the relevant sentiment score and other metrics
sentiment_score = -0.250
confidence = 0.85
momentum = +0.000
print(f"Sentiment Score: {sentiment_score}, Confidence: {confidence}, Momentum: {momentum}")
Next, we need to analyze the narrative framing itself. This is key to understanding the context of the sentiment. We’ll run the reason string found in the cluster back through our API to score it:
# Define the meta-sentiment input
meta_sentiment_input = "Clustered by shared themes: market, news, march, 2026:, dow."

# API call to fetch the meta-sentiment score
meta_response = requests.post('https://api.pulsebit.com/sentiment', json={"text": meta_sentiment_input})
meta_data = meta_response.json()

print(f"Meta Sentiment Score: {meta_data['score']}, Confidence: {meta_data['confidence']}")
With this code, we can effectively capture the sentiment of Spanish articles and evaluate the narrative's framing. Now, let’s look at three specific things we can build using this newfound understanding:
Sentiment Alert System: Build an alert for when sentiment around the stock market dips below a certain threshold (e.g., -0.20) specifically for Spanish articles. This can be set up using a geo filter to ensure you’re only alerted about significant sentiment shifts in regions where Spanish is dominant.
Meta-Sentiment Dashboard: Create a dashboard that visualizes the meta-sentiment scores of narratives clustered around trending topics. For instance, if you detect forming themes like "stock(+0.00)" or "markets(+0.00)" alongside mainstream narratives, you can better understand how these themes evolve over time.
Trend Correlation Analysis: Using the geo filter, correlate sentiment scores with market movements by tracking how sentiment changes in real-time around specific events. This could involve analyzing market responses to news articles with scores above a certain confidence level, like 0.85, to gauge immediate impacts.
If you want to get started with these insights, check out our documentation at pulsebit.lojenterprise.com/docs. You can copy-paste and run this in under 10 minutes, and we believe you’ll find it as enlightening as we did.

Top comments (0)