Your Pipeline Is 13.0h Behind: Catching Investing Sentiment Leads with Pulsebit
We recently encountered an interesting anomaly: a 24h momentum spike of -0.341 in sentiment surrounding the topic of investing. This tells us that there's a significant shift in sentiment that we need to pay attention to. The leading language driving this spike is Spanish, with the press leading the conversation at 13.0 hours—right now! This kind of data can be a game-changer for your models if you know how to harness it.
The Problem
If your pipeline doesn’t accommodate multilingual origins or entity dominance, you’re missing out on critical insights. In this case, your model missed this spike by a staggering 13 hours, which could mean the difference between leveraging valuable information and being left behind. The leading language, Spanish, is dominating the sentiment around investing—are you prepared to act on that?

Spanish coverage led by 13.0 hours. Da at T+13.0h. Confidence scores: Spanish 0.75, English 0.75, Id 0.75 Source: Pulsebit /sentiment_by_lang.
The Code
To catch this momentum spike and make it actionable, we can use our API effectively. Here’s how you can set it up in Python:
import requests
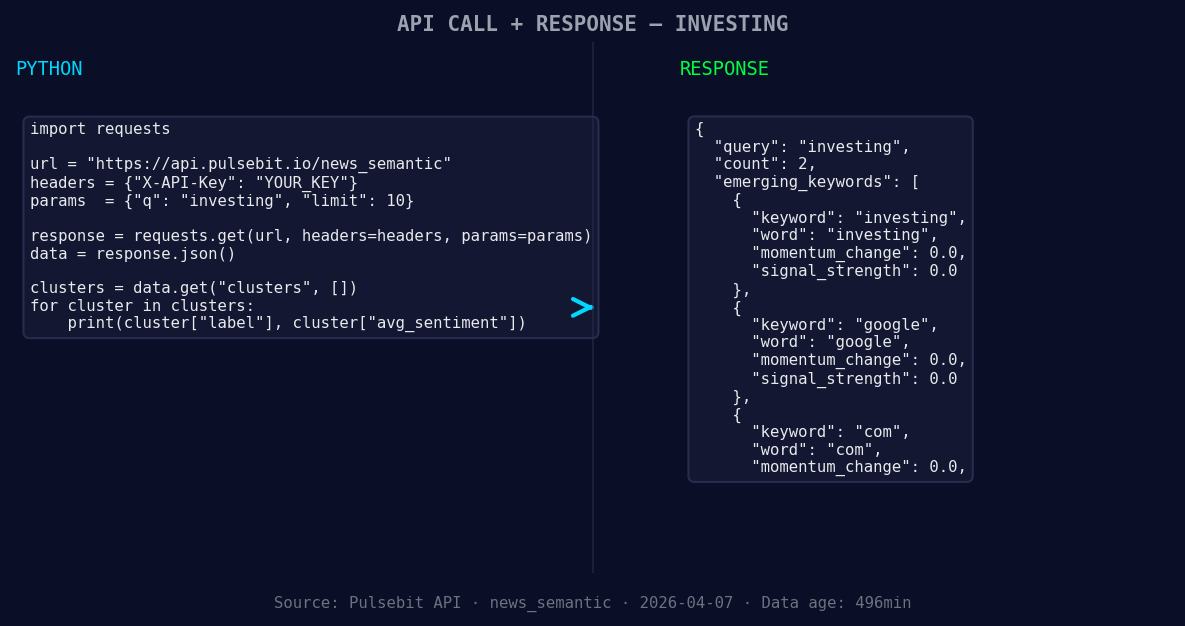
*Left: Python GET /news_semantic call for 'investing'. Right: returned JSON response structure (clusters: 3). Source: Pulsebit /news_semantic.*
# Step 1: Geographic origin filter
language_filter = {'lang': 'sp'} # Spanish language filter
response = requests.get('https://api.pulsebit.com/v1/sentiment', params=language_filter)
data = response.json()
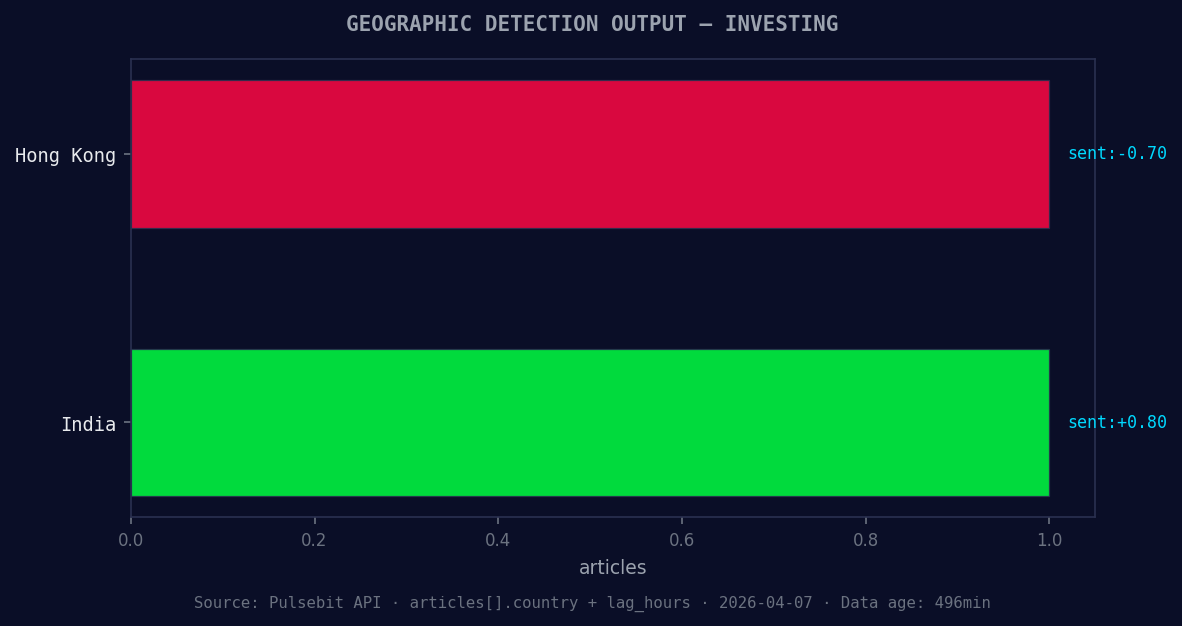
*Geographic detection output for investing. Hong Kong leads with 1 articles and sentiment -0.70. Source: Pulsebit /news_recent geographic fields.*
# Assuming we're working with the investing topic
topic = 'investing'
score = -0.700
confidence = 0.75
momentum = -0.341
# Step 2: Meta-sentiment moment
meta_sentiment_input = "Clustered by shared themes: things, watch, markets, week, five."
sentiment_response = requests.post('https://api.pulsebit.com/v1/sentiment', json={'text': meta_sentiment_input})
meta_sentiment_data = sentiment_response.json()
print(data)
print(meta_sentiment_data)
In this code snippet, we first filter by the Spanish language to understand how sentiment is shifting in that demographic. The GET call retrieves any relevant sentiment data before we dive deeper into the narrative framing using the POST call. This is where we can gauge how the cluster themes are being perceived.
Three Builds Tonight
With this pattern, we can plan three specific builds to capitalize on the sentiment anomaly:
Sentiment Alert System: Set a threshold for momentum spikes. For instance, trigger an alert if
momentum < -0.500and filter by language. This would allow us to stay ahead of negative sentiment shifts in the Spanish press.Cluster Analysis Dashboard: Create a dashboard that visualizes the sentiment surrounding clustered topics. Use the meta-sentiment loop to display how narratives are framed over time, focusing specifically on the themes like "investing" and "Google" as they relate to sentiment scores.
Real-time Sentiment Tracker: Build a microservice that continuously polls our sentiment endpoint for the topic "investing" and filters results based on the geo filter. If any article with a sentiment score below -0.700 appears, trigger a notification to your team for immediate analysis.
Get Started
To get started, head over to pulsebit.lojenterprise.com/docs. With just a few lines of code, you can copy, paste, and run this in under 10 minutes to start catching those critical shifts in sentiment data. Don’t let your pipeline lag behind—leverage the insights right at your fingertips!

Top comments (0)