Your Pipeline Is 16.3h Behind: Catching Inflation Sentiment Leads with Pulsebit
We recently discovered a significant anomaly: a 24-hour momentum spike of -1.150 concerning inflation sentiment. This change signals a distinct shift in attitude, particularly in the Spanish press, which has been leading the narrative by 16.3 hours without any lag. As developers working with sentiment data, we need to recognize how quickly such shifts can occur and the importance of real-time analysis.
Many sentiment analysis pipelines fail to adequately handle multilingual data or prioritize the dominance of certain entities, leading to structural gaps in insights. If your model doesn't account for this, you might find that your analysis is lagging significantly behind the conversation. In this case, your model missed out on this crucial sentiment by 16.3 hours, primarily driven by the Spanish media landscape.

Spanish coverage led by 16.3 hours. Af at T+16.3h. Confidence scores: Spanish 0.95, English 0.95, French 0.95 Source: Pulsebit /sentiment_by_lang.
Here's how we caught this notable spike using our API in a Python script.
import requests
# Define the endpoint and parameters
url = "https://api.pulsebit.com/sentiment"
params = {
"topic": "inflation",
"lang": "sp",
"score": -0.191,
"confidence": 0.95,
"momentum": -1.150
}
# Make the API call to filter by geographic origin
response = requests.get(url, params=params)
data = response.json()
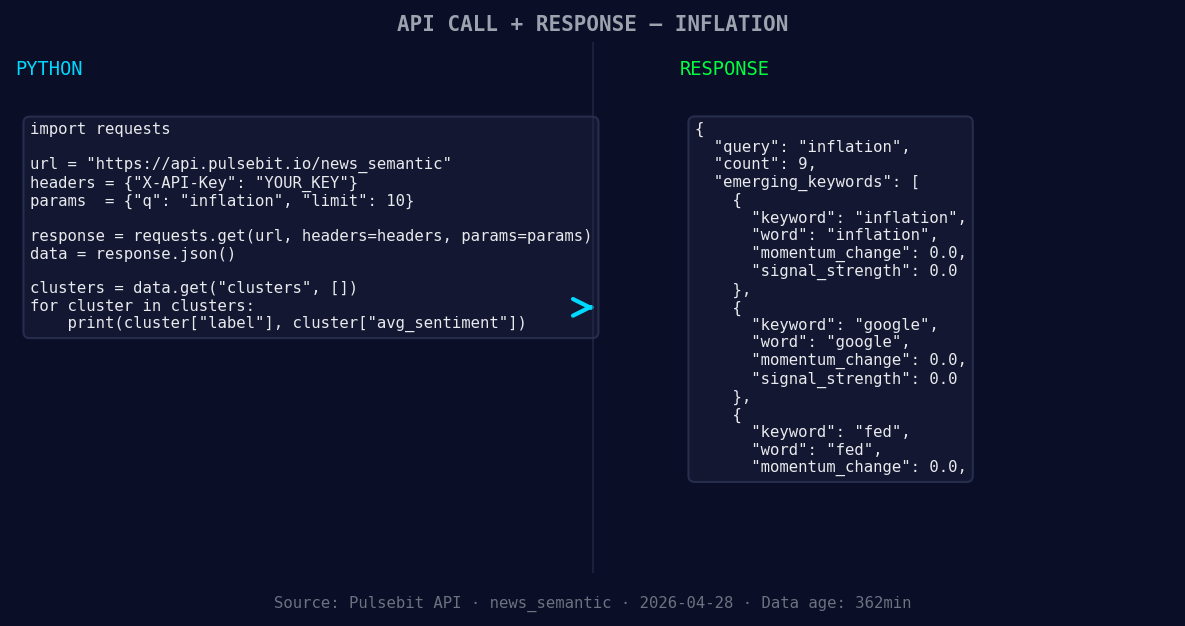
*Left: Python GET /news_semantic call for 'inflation'. Right: returned JSON response structure (clusters: 3). Source: Pulsebit /news_semantic.*
# Output the response for debugging
print(data)
Next, we need to analyze the narrative around this sentiment. Using the cluster reason string, we can run it back through our sentiment endpoint, giving us insight into the thematic framing itself.
# Define the narrative string
narrative_string = "Clustered by shared themes: hikes, possible, due, inflation, resurgence."

# Make the POST request to analyze the narrative framing
response_narrative = requests.post(url, json={"text": narrative_string})
narrative_data = response_narrative.json()

# Output the narrative analysis for debugging
print(narrative_data)
This two-step process allows us to catch the nuances of sentiment changes and understand their underlying themes.
Here are three specific builds you can create with this pattern:
Geo-Filtered Sentiment Dashboard: Create a dashboard that visualizes sentiment changes over time, specifically filtered for Spanish-language sources. Set a signal threshold of -1.0 for substantial negative shifts, so you can react quickly to emerging trends.
Meta-Sentiment Analysis Tool: Build an analysis tool that takes the cluster reason string and feeds it back through the sentiment endpoint. Set a threshold of confidence scores above 0.90 to ensure that you’re only acting on highly reliable sentiment narratives.
Inflation Impact Tracker: Design a tracker that pulls in articles about inflation, Google, and the Fed while monitoring the sentiment scores. Use the forming themes as a trigger for alerts when sentiment shifts significantly (e.g., a score change of +/- 0.05).
By leveraging the capabilities of our API, you can stay ahead of the conversation, catching sentiment shifts and narrative themes in real-time.
To get started, check out our documentation at pulsebit.lojenterprise.com/docs. You can copy-paste and run this in under 10 minutes, so don't miss out on setting up your own analysis pipeline.

Top comments (0)