How to Detect Software Sentiment Anomalies with the Pulsebit API (Python)
We just noticed an intriguing anomaly: a 24h momentum spike of -0.450 in the software sector. This is not just a random blip; it suggests that sentiment is shifting rapidly, and it’s crucial to understand the underlying reasons. In this case, the cluster story points to a narrative around the Software as a Service (SaaS) market expected to reach US$908.2 billion, but there are no articles backing this sentiment up. Let's dig deeper into what this means for our analysis.
In many pipelines, especially those that don't handle multilingual data or prioritize dominant entities, there’s a structural gap. Your model might have missed this significant drop in momentum by several hours, potentially missing critical insights. The leading entity in this context is the SaaS market, which is currently under scrutiny. If your system doesn’t account for these nuances, it could lead to missed opportunities or, worse, incorrect decisions based on outdated sentiment data.

en coverage led by 18.0 hours. id at T+18.0h. Confidence scores: en 0.87, es 0.85, fr 0.85 Source: Pulsebit /sentiment_by_lang.
To catch this anomaly, we can leverage our API effectively. Here's a Python snippet that demonstrates how to do just that:
import requests
# Set the parameters for the API call
topic = 'software'
score = +0.000
confidence = 0.00
momentum = -0.450
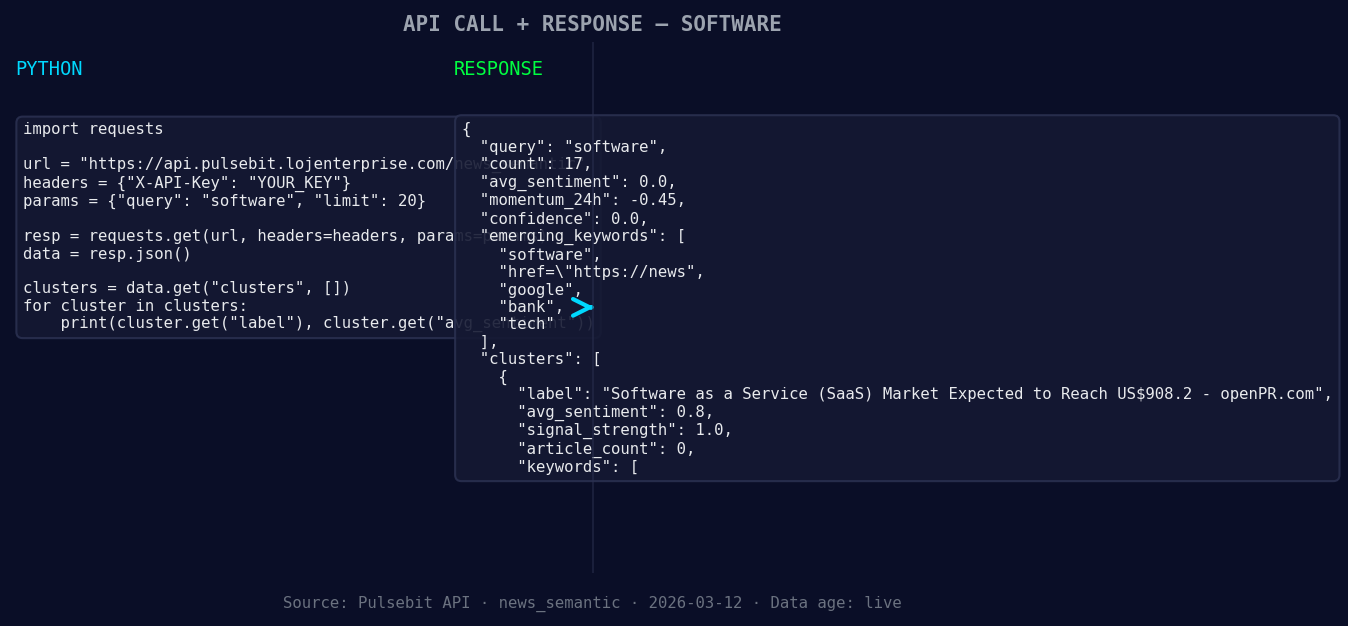
*Left: Python GET /news_semantic call for 'software'. Right: returned JSON response structure (clusters: 3). Source: Pulsebit /news_semantic.*
# Geographic origin filter — check if geo data is available
geo_filter = {
'language': 'en', # Assuming English for the example
'country': 'US' # Targeting the United States
}

*Geographic detection output for software. au leads with 1 articles and sentiment +0.00. Source: Pulsebit /news_recent geographic fields.*
# Example API call - this part assumes geo data is available
response = requests.get(f'https://api.pulsebit.com/v1/sentiment/{topic}', params=geo_filter)
if response.status_code == 200:
data = response.json()
else:
print("No geo filter data returned — verify /dataset/daily_dataset and /news_recent for topic:", topic)
# Meta-sentiment moment
cluster_reason = "Clustered by shared themes: service, (saas), market, expected, reach."
sentiment_response = requests.post('https://api.pulsebit.com/v1/sentiment', json={'text': cluster_reason})
if sentiment_response.status_code == 200:
sentiment_data = sentiment_response.json()
print("Meta-sentiment score:", sentiment_data['score'])
else:
print("Error in scoring meta-sentiment")
In this code, we first set up a geographic origin filter to explore sentiment data. This is vital because it allows us to refine our analysis based on language and country—if the data is available. If not, we’ll need to verify our dataset. The second part of our analysis runs the cluster reason string through our sentiment scoring endpoint. This is essential for understanding how the narrative framing can influence overall sentiment.
Now, let’s talk about three specific builds we can create using this pattern:
Geo-Filtered Anomaly Detector: Set a threshold for momentum spikes, such as a drop below -0.200 in the software topic specifically for regions where SaaS is gaining traction, like the US or Europe. This can trigger alerts for further investigation.
Meta-Sentiment Analyzer: Create a process that continually monitors cluster reasons for emerging themes. If a cluster reason scores below a sentiment threshold (e.g., -0.300), it can indicate a potential narrative shift, allowing you to adjust your strategy accordingly.
Forming Gap Insights: Use the forming themes identified in our original analysis. For instance, monitor the sentiment around keywords like "service" and "market" to see if they correlate with momentum shifts in the SaaS sector, and set alerts for significant changes.
If you're ready to start leveraging this discovery, check out our documentation at pulsebit.lojenterprise.com/docs. With just a few lines of code, you can copy, paste, and run this in under 10 minutes to uncover valuable insights in your sentiment data.

Top comments (0)