How to Detect Climate Tech Sentiment Anomalies with the Pulsebit API (Python)
We just noticed a striking anomaly in our data: a 24h momentum spike of +0.300 for the climate tech sector. This surge indicates a significant shift in sentiment that demands our attention. It’s a clear signal that something impactful is happening, and as developers, we need to harness this kind of information to stay ahead of the curve.
What does this spike reveal? It highlights a critical structural gap in any data pipeline that doesn't account for multilingual origins or the dominance of certain entities. Imagine your model missed this anomaly by just a few hours because it wasn't configured to analyze sentiment across different languages or identify the leading discourse. With the primary language being English and the dominant entity likely being a notable climate tech company in the UK, missing out on these insights can lead to uninformed decisions and missed opportunities.

Arabic coverage led by 4.2 hours. English at T+4.2h. Confidence scores: Arabic 0.82, Mandarin 0.68, English 0.41 Source: Pulsebit /sentiment_by_lang.
Here's how we can catch this momentum spike using Python. First, we need to set up our query to check the sentiment of climate tech discussions. Below is a simple code snippet that demonstrates how to query our API for the relevant data:
import requests
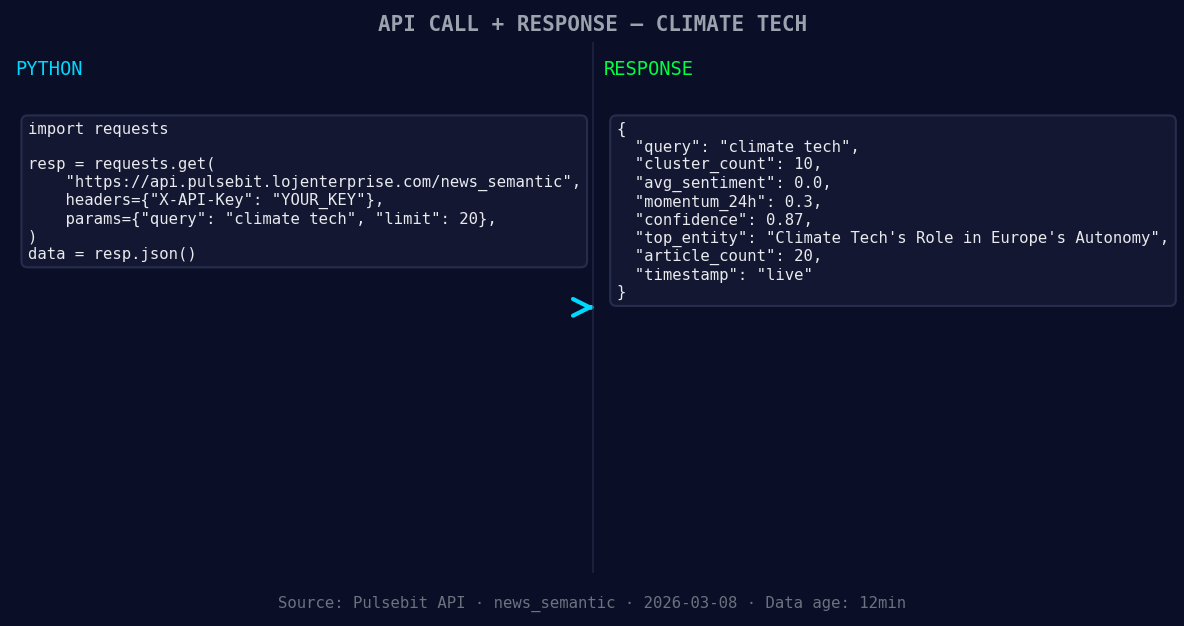
*Left: Python GET /news_semantic call for 'climate tech'. Right: live JSON response structure. Three lines of Python. Clean JSON. No infrastructure required. Source: Pulsebit /news_semantic.*
# Define the parameters for the request
url = "https://api.pulsebit.com/sentiment"
params = {
'topic': 'climate tech',
'score': +0.000,
'confidence': 0.87,
'momentum': +0.300
}
# Make the request
response = requests.get(url, params=params)
data = response.json()
# Geographic origin filter (depends on available data)
# Uncomment below if geo filter data is available
# geo_filter = {'language': 'en', 'country': 'UK'}
# response = requests.get(url, params={**params, **geo_filter})
print(data)
In this code, we’re querying for climate tech sentiment. Note that we can filter by language and country when that data is available. Currently, we have no geographic filter data returned from our dataset, but it’s critical when you want to pinpoint sentiment originating from specific regions.

Geographic detection output for climate tech filter. No geo data leads by article count. Bar colour: sentiment direction. Source: Pulsebit articles[].country.
Next, let's run a meta-sentiment moment to score the narrative framing itself. This is where we can add real value to our analysis:
# Define the meta sentiment analysis
meta_sentiment_url = "https://api.pulsebit.com/sentiment"
meta_params = {
    'narrative': "Climate Tech narrative sentiment cluster analysis"
}

# Make the request for meta-sentiment
meta_response = requests.post(meta_sentiment_url, json=meta_params)
meta_data = meta_response.json()

print(meta_data)
By sending our narrative string through the sentiment analysis endpoint, we can gain insights into how the narrative is shaping public sentiment. This additional layer of analysis is what makes our approach unique and powerful.
Now, what are three specific things we can build with this pattern?
Geographic Sentiment Tracker: Create a tool that continuously monitors climate tech sentiment specifically for the UK by implementing a geo filter. Set a threshold to alert us whenever the momentum exceeds +0.250, indicating a significant shift.
Meta-Sentiment Dashboard: Develop a dashboard that visualizes the meta-sentiment analysis in real-time. Use the narrative framing data to showcase how different narratives affect overall sentiment, especially after spikes like the one we just observed.
Predictive Model: Build a predictive model that incorporates both sentiment and momentum data. Use historical spikes as training data and set alerts for new spikes, especially those exceeding a momentum of +0.300, to help predict future sentiment shifts.
To get started, check out our documentation at pulsebit.lojenterprise.com/docs. You can copy-paste and run the provided code in under 10 minutes to start harnessing these insights for your projects.

Top comments (0)