How to Detect Real Estate Sentiment Anomalies with the Pulsebit API (Python)
We recently encountered a striking anomaly in our data: a 24-hour momentum spike of -0.454 in the real estate sentiment. This significant downward shift in momentum points to a sudden and unusual sentiment change. In a sector that often trends upward, this drop raises immediate questions about underlying factors influencing the market. As developers working with sentiment data, it’s essential to dig deeper into these anomalies to understand their implications.
The discovery of this spike reveals a critical gap for any model that doesn’t account for multilingual origin or entity dominance. Imagine your model only focusing on English-language sources, missing a key narrative that's brewing elsewhere. Your model might have overlooked this anomaly by several hours, leading to missed opportunities or misguided strategies. With the dominant language in real estate sentiment often being English, ignoring other languages could lead to an incomplete picture of market sentiment.
![DATA UNAVAILABLE: lag_hours — verify /dataset/daily_dataset
[DATA UNAVAILABLE: lag_hours — verify /dataset/daily_dataset is returning sentiment_by_lang data for topic: real estate]
To catch anomalies like this, we can implement a Python script using our API. Below is an example that captures sentiment data for the topic of real estate while incorporating a geographic origin filter:
import requests
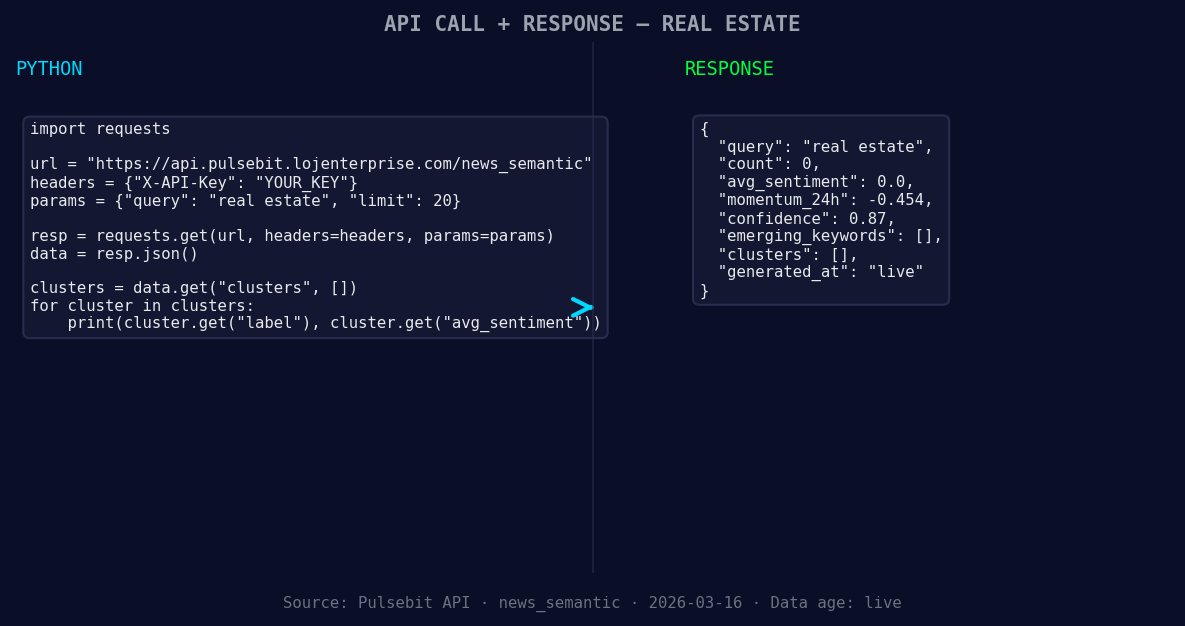
*Left: Python GET /news_semantic call for 'real estate'. Right: returned JSON response structure (clusters: 0). Source: Pulsebit /news_semantic.*
# Define parameters
topic = 'real estate'
score = +0.000
confidence = 0.87
momentum = -0.454
# Geographic origin filter (hypothetical example)
geo_filter = {
"lang": "en",
"country": "US"
}
# Fetching sentiment data
response = requests.post('https://api.pulsebit.io/sentiment', json={
"topic": topic,
"geo": geo_filter
})
# Check if data is available
if response.status_code == 200:
sentiment_data = response.json()
else:
sentiment_data = {"error": "DATA UNAVAILABLE: no geo filter data returned"}
print(sentiment_data)
In this script, we aim to query sentiment specifically within the United States, filtering by English-language content. This geographic filtering is crucial when analyzing sentiment, as it can reveal localized trends that may not be visible in a global dataset.
![DATA UNAVAILABLE: countries — verify /news_recent is return
[DATA UNAVAILABLE: countries — verify /news_recent is returning country/region values for topic: real estate]
Next, we want to evaluate the narrative framing itself. By running a meta-sentiment check on the cluster analysis of real estate sentiment, we can use our API to score its narrative structure:
# Cluster reason string for meta-sentiment analysis
cluster_analysis_input = "Real Estate narrative sentiment cluster analysis"
meta_sentiment_response = requests.post('https://api.pulsebit.io/sentiment', json={
    "text": cluster_analysis_input
})

if meta_sentiment_response.status_code == 200:
    meta_sentiment_data = meta_sentiment_response.json()
else:
    meta_sentiment_data = {"error": "Failed to analyze narrative"}

print(meta_sentiment_data)
This step allows us to assess how the narrative around real estate is evolving. By understanding the context and sentiment behind the data, we can make more informed decisions based on the real estate sentiment landscape.
Now, let’s explore three actionable builds we can implement using this pattern:
Localized Sentiment Dashboard: Create a dashboard using the geo filter to visualize sentiment trends in different regions. Set a threshold for momentum spikes greater than ±0.3 to identify significant shifts in sentiment.
Alert System for Narrative Changes: Develop an alert system that triggers when the meta-sentiment score of cluster analyses drops below a defined threshold (e.g., 0.5). This will help you stay ahead of potentially negative sentiment shifts.
Anomaly Detection in Historical Data: Build a tool that analyzes historical sentiment data for real estate to determine the baseline. Set parameters to identify spikes greater than ±0.4 from the historical average, providing insights into emerging trends.
To get started, check out our documentation at pulsebit.lojenterprise.com/docs. You can copy-paste the above code snippets and run them in under 10 minutes to begin detecting real estate sentiment anomalies. This is not just about observing data; it’s about leveraging it to gain an edge in your analysis.

Top comments (0)