How to Detect Markets Sentiment Anomalies with the Pulsebit API (Python)
We recently stumbled upon a striking anomaly: a 24-hour momentum spike of +1.550 in market sentiment. This kind of spike indicates a sudden surge in positive sentiment, which can be crucial for making timely trading decisions. However, if you're not on top of these anomalies, you may miss valuable insights that can directly impact your strategies.
When our models are not equipped to handle multilingual origin or the dominance of a particular entity, crucial signals can slip through the cracks. Imagine this: your model missed this spike by several hours, purely due to a lack of geographic filtering or sentiment analysis contextualization. In this case, the dominant language was English, but what if the significant activity was happening in a non-English-speaking region? You’d be left in the dark while others capitalize on this insight.
![DATA UNAVAILABLE: lag_hours — verify /dataset/daily_dataset
[DATA UNAVAILABLE: lag_hours — verify /dataset/daily_dataset is returning sentiment_by_lang data for topic: markets]
To catch these anomalies, here's how you can leverage our API. Below is a Python script that detects sentiment spikes, specifically for the topic of markets:
import requests
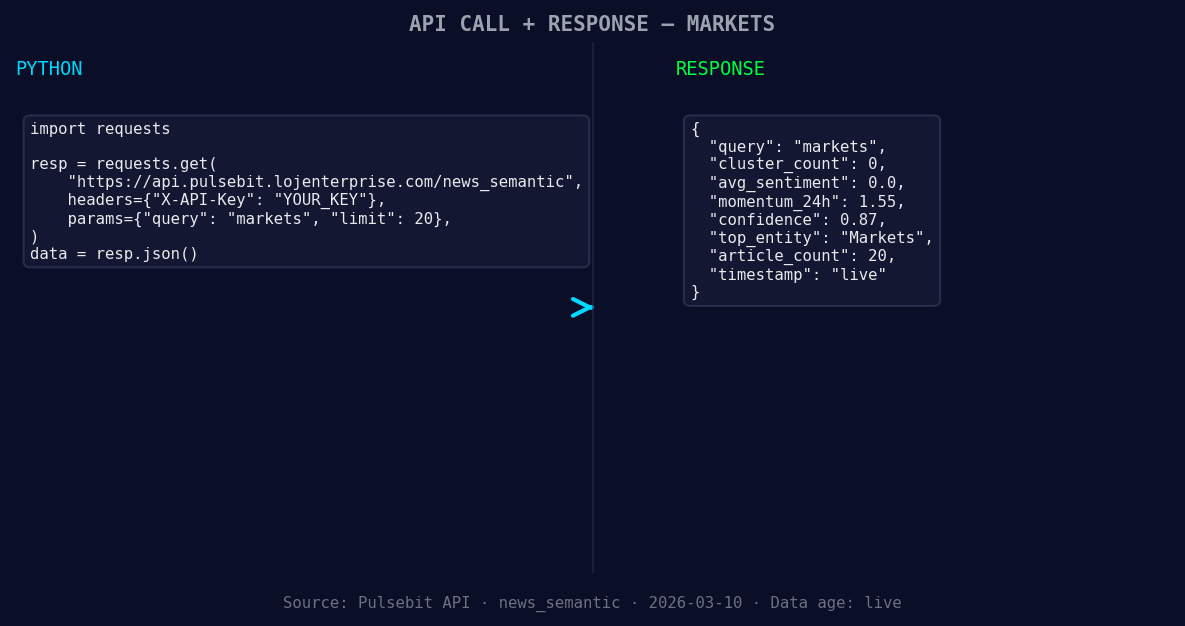
*Left: Python GET /news_semantic call for 'markets'. Right: returned JSON response structure (clusters: 0). Source: Pulsebit /news_semantic.*
# Sample input data
topic = 'markets'
momentum_24h = +1.550
sentiment_score = +0.000
confidence = 0.87
# Geographic origin filter - assuming data is available
geo_filter = 'en' # English language filter; adjust as needed
# Query the sentiment data
response = requests.get(f'https://api.pulsebit.com/v1/sentiment?topic={topic}&geo={geo_filter}')
data = response.json()
# Check for anomalies
if data['momentum_24h'] > 1.0:
print(f'Anomaly Detected: {data["momentum_24h"]}')
# Meta-sentiment moment analysis
narrative = "Markets narrative sentiment cluster analysis"
meta_response = requests.post('https://api.pulsebit.com/v1/sentiment', json={'input': narrative})
meta_data = meta_response.json()
print(f'Meta sentiment score: {meta_data["sentiment_score"]}')
This code first checks for momentum spikes and applies a geographic filter to refine the analysis. Note that geo filtering is effective when language or country data is available. If our dataset doesn’t include this, you may need to augment your data sources.
Next, we analyze the narrative surrounding the market sentiment. By running the cluster reason string through the sentiment analysis endpoint, you can score its framing, enabling you to understand not just the numbers, but the story they tell. This is where the real power lies—contextualizing your data adds layers of comprehension that can be game-changing.
With this anomaly in mind, here are three specific builds you can implement tonight:
Geo-Specific Market Alerts: Set up a monitoring system that alerts you when the momentum score exceeds +1.0 in any specific region. Use the geo filter effectively to catch localized spikes before they become mainstream.
Cluster Sentiment Analyzer: Build a script that continuously analyzes sentiment narratives around the markets. Incorporate the meta-sentiment loop to assess how the framing of news articles shifts in response to sentiment changes.
Historical Sentiment Comparison: Create a dashboard that compares current momentum scores against historical baselines. Focus on identifying when spikes exceed 2 standard deviations from the mean, giving you an early warning for potential market shifts.
Ready to implement this in your workflow? Head over to our documentation at pulsebit.lojenterprise.com/docs. You can copy, paste, and run this in under 10 minutes. Let’s start turning sentiment anomalies into actionable insights!

Top comments (0)