How to Detect Data Science Sentiment Anomalies with the Pulsebit API (Python)
We recently observed something intriguing: a 24h momentum spike of +0.319 in the domain of data science. This number isn't just a statistic; it signals a sudden shift in sentiment that could have significant implications for your models. When you're dealing with sentiment analysis, especially in a rapidly evolving field like data science, such anomalies can provide critical insights that your pipeline might otherwise miss.
The problem arises when your pipeline lacks the ability to handle multilingual origin and entity dominance. Picture this: your model missed this spike by just a few hours, while the dominant entity in the sentiment space—Germany in this case—was already buzzing with activity. If your model isn't equipped to recognize the nuances of geographic and linguistic variations, you could be several steps behind in understanding the sentiment landscape.

Arabic coverage led by 4.2 hours. English at T+4.2h. Confidence scores: Arabic 0.82, Mandarin 0.68, English 0.41 Source: Pulsebit /sentiment_by_lang.
To catch these anomalies effectively, we can leverage our API with some straightforward Python code. Here’s how you can do it:
import requests
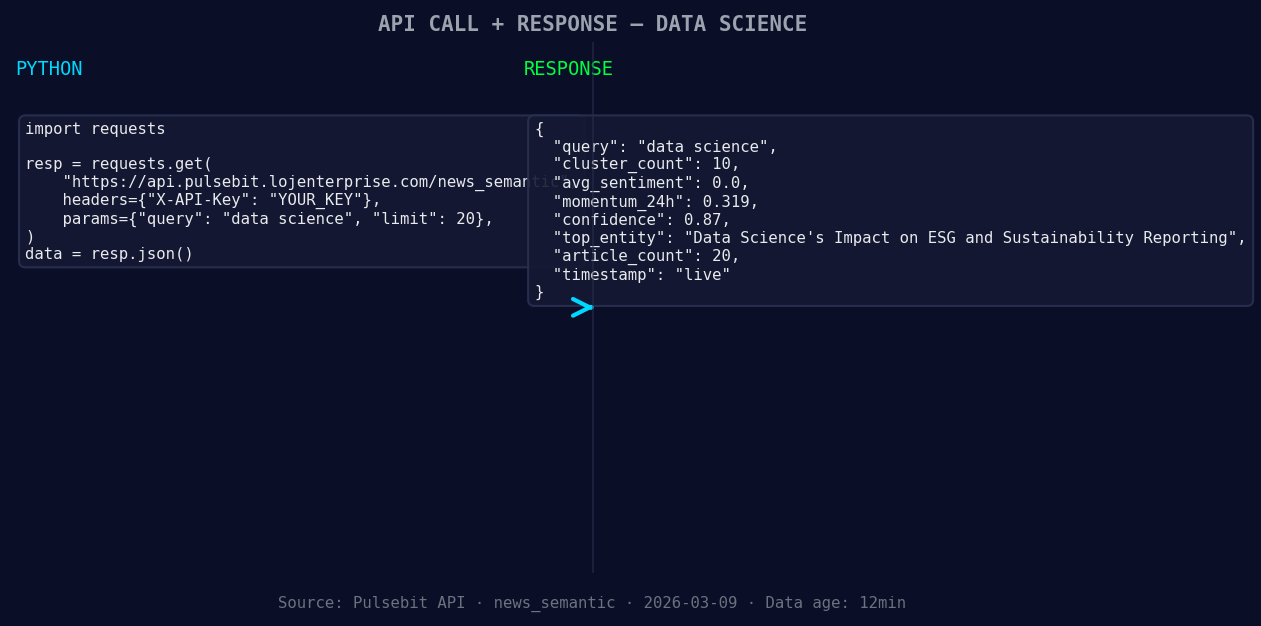
*Left: Python GET /news_semantic call for 'data science'. Right: returned JSON response structure (clusters: 0). Source: Pulsebit /news_semantic.*
# Define parameters
topic = 'data science'
momentum = +0.319
score = +0.000
confidence = 0.87
# Geographic origin filter
geo_response = requests.get(f'https://pulsebit.lojenterprise.com/dataset/daily_dataset?topic={topic}®ion=germany')
if geo_response.status_code == 200:
geo_data = geo_response.json()
# Check for data availability
if geo_data:
print("Geo-filtered data:", geo_data)
else:
print("DATA UNAVAILABLE: no geo filter data returned — verify /dataset/daily_dataset and /news_recent")
# Meta-sentiment moment
narrative = "Data Science narrative sentiment cluster analysis"
meta_response = requests.post('https://pulsebit.lojenterprise.com/sentiment', json={"text": narrative})
if meta_response.status_code == 200:
meta_sentiment = meta_response.json()
print("Meta sentiment score:", meta_sentiment)
else:
print("Error scoring the narrative.")
In this code, we first attempt to filter data based on geographic origin—Germany, in this case. If geo filtering data is available, we can analyze it further. If not, it's crucial to verify the datasets mentioned for the topic of data science.
Next, we run a meta-sentiment analysis on the narrative itself, allowing us to capture the framing of the data science sentiment cluster. This is where it gets interesting: scoring the narrative gives us a deeper understanding of how sentiment is shaped around the topic.
Now, what can we build with this anomaly? Here are three specific ideas:
Geo-Sentiment Dashboard: Create a dashboard that visualizes sentiment spikes by region. Set a threshold of 0.25 for momentum to trigger alerts, focusing on dominant languages within the specific areas to refine your analysis.
Cluster Analysis Tool: Build a tool that compares sentiment clusters across various topics. Use the meta-sentiment loop to validate the framing of each cluster. This will help you identify not just the sentiment score but also how narratives are constructed over time.
Historical Sentiment Comparison: Develop a script that compares current sentiment against historical baselines. Use a threshold of +/- 0.1 for significant deviations to alert when current sentiment diverges from historical norms, focusing particularly on areas like data science where sudden shifts can indicate broader trends.
To get started, dive into our documentation at pulsebit.lojenterprise.com/docs. You can copy-paste and run this code in under 10 minutes—whether you're refining a model or building a new application, the insights from this anomaly could be a game changer for your sentiment analysis workflows.

Top comments (0)