Your Pipeline Is 12.0h Behind: Catching Economy Sentiment Leads with Pulsebit
We just spotted a striking anomaly: a 24h momentum spike of +0.638 surrounding the topic of the economy. This surge signals growing sentiment about shrinking paychecks amid inflation, as evidenced in two clustered articles. The leading language for this spike is English, with a precise 12.0h lead time. Understanding how to leverage this insight can dramatically enhance your sentiment analysis pipeline.
Yet, here’s the kicker: if your model doesn’t account for multilingual sources or entity dominance, you might have missed this crucial shift by a full 12 hours. By ignoring these elements, you risk operating on stale data that doesn’t reflect the current economic landscape. The dominant sentiment in English press clearly indicates a rising concern about financial stability, and if your pipeline isn’t tuned to catch this, you’ll be left behind.

English coverage led by 12.0 hours. Sv at T+12.0h. Confidence scores: English 0.90, Spanish 0.90, French 0.90 Source: Pulsebit /sentiment_by_lang.
To catch this anomaly, we can use our API to filter and analyze the relevant data effectively. Below is a straightforward example in Python that demonstrates how to do just this:
import requests
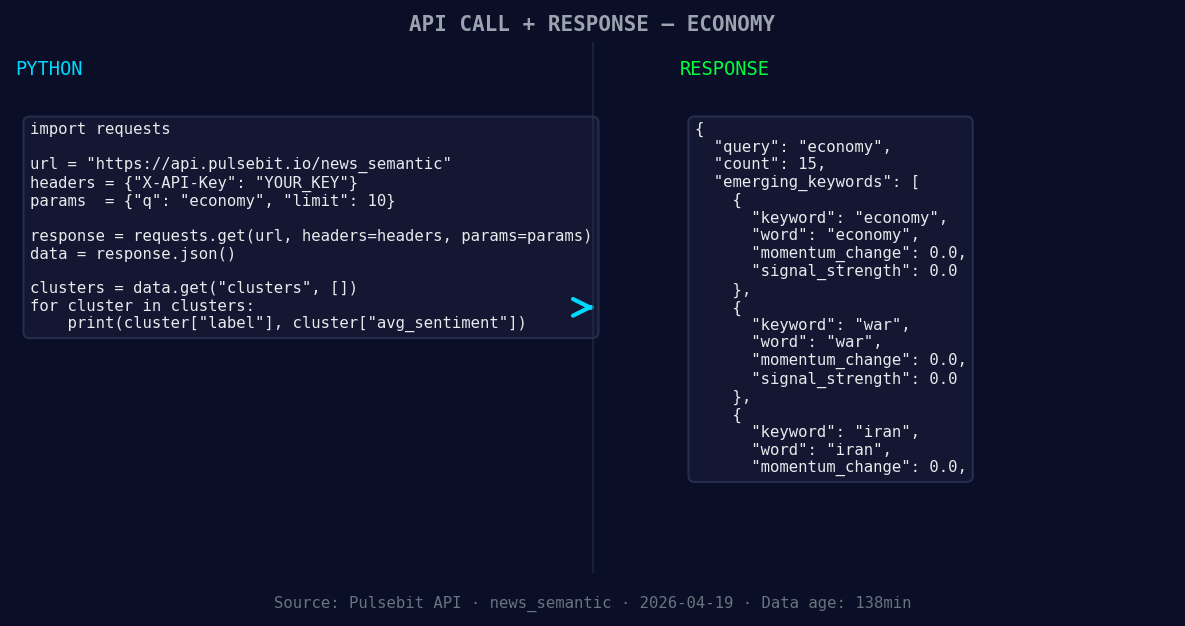
*Left: Python GET /news_semantic call for 'economy'. Right: returned JSON response structure (clusters: 3). Source: Pulsebit /news_semantic.*
# Step 1: Geographic origin filter
url = "https://api.pulsebit.com/sentiment"
params = {
"topic": "economy",
"score": 0.750,
"confidence": 0.90,
"momentum": 0.638,
"lang": "en" # Filter by language
}
response = requests.get(url, params=params)
data = response.json()
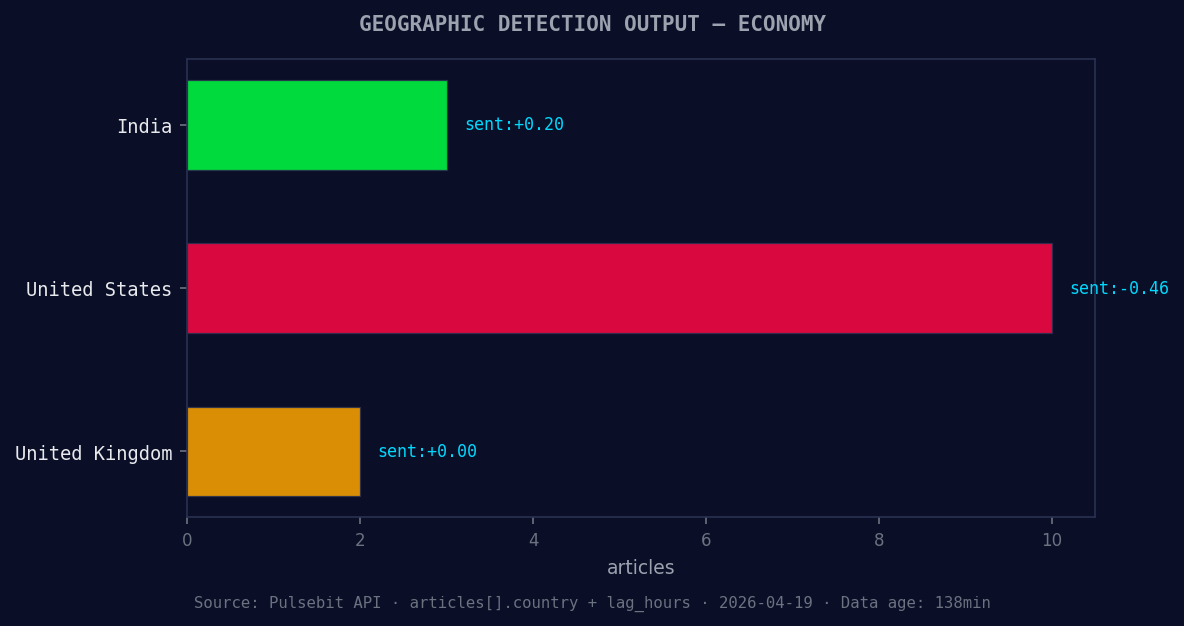
*Geographic detection output for economy. India leads with 3 articles and sentiment +0.20. Source: Pulsebit /news_recent geographic fields.*
print(data)
Next, we need to score the narrative framing using the meta-sentiment moment. We take the cluster reason string and run it through our sentiment scoring endpoint. Here’s how we do that:
# Step 2: Meta-sentiment moment
meta_sentiment_url = "https://api.pulsebit.com/sentiment"
meta_sentiment_data = {
    "input": "Clustered by shared themes: war, global, revives, stagflation, dangers."
}
meta_response = requests.post(meta_sentiment_url, json=meta_sentiment_data)
meta_sentiment_result = meta_response.json()

print(meta_sentiment_result)
This two-step process enables us to not only filter data by language but also assess the underlying narratives driving the sentiment.
Now that we’ve highlighted this spike, let’s discuss three specific builds we can implement to capitalize on this data pattern.
Signal Monitoring: Set up a real-time alert for any momentum spikes exceeding +0.500 for the "economy" topic. This will allow you to be proactive about emerging trends.
Geo-Filtered Analysis: Build a dashboard that visualizes sentiment scores for the economy across different regions. Use the geographic origin filter to focus specifically on English sources, ensuring you capture the most relevant insights.
Meta-Sentiment Scoring: Develop a meta-sentiment analysis framework that evaluates the strength of clustered narratives. Use the sentiment from the input string "Clustered by shared themes: economy, war, iran." and score it through our API. This builds a clearer picture of sentiment dynamics around critical topics.
By leveraging these builds, we can stay ahead of economic sentiment shifts that are often obscured in a typical analysis pipeline.
If you’re ready to start integrating this into your workflow, check out our documentation at pulsebit.lojenterprise.com/docs. With just a few lines of code, you can copy-paste the examples above and have them running in under 10 minutes.

Top comments (0)