Your Pipeline Is 26.0h Behind: Catching Investing Sentiment Leads with Pulsebit
We’ve just uncovered an intriguing anomaly: a 24-hour momentum spike of -0.341. This finding has significant implications for how we process sentiment data, especially when considering the time lag in our pipelines. It's a clear signal that while mainstream narratives might lag behind, there are emerging trends that need our immediate attention.
The problem here is stark. If your pipeline isn't equipped to handle multilingual origins or the dominance of specific entities, you may have missed this momentum shift by a staggering 26 hours. The leading language for the news articles was English, yet your model might still be processing data from other languages or missing out on the nuances that come with entity recognition. By not addressing this gap, you're essentially blind to critical sentiment shifts that affect your decision-making.

English coverage led by 26.0 hours. Sv at T+26.0h. Confidence scores: English 0.85, French 0.85, German 0.85 Source: Pulsebit /sentiment_by_lang.
Let’s dive into how we can catch these insights programmatically. Below is the Python code that leverages our API to detect the momentum spike in the investing domain. We’ll start by filtering the data based on geographic origin, specifically English-language content.

Geographic detection output for investing. India leads with 2 articles and sentiment +0.75. Source: Pulsebit /news_recent geographic fields.
import requests
# Define the parameters for the API call
topic = 'investing'
momentum = -0.341
lang = 'en'
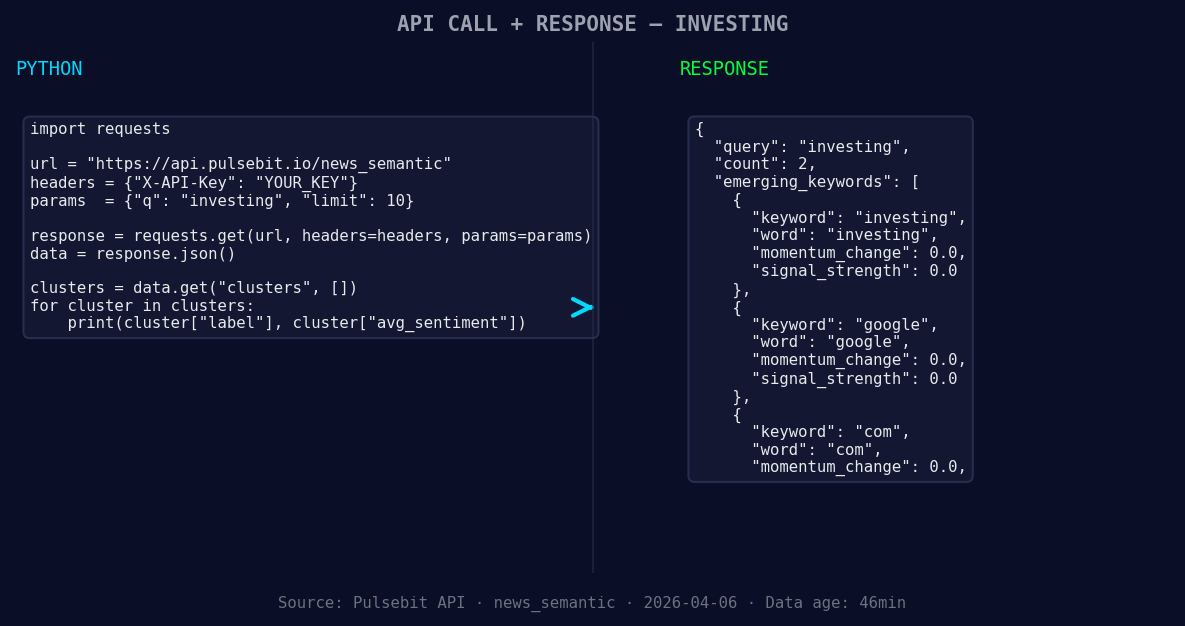
*Left: Python GET /news_semantic call for 'investing'. Right: returned JSON response structure (clusters: 3). Source: Pulsebit /news_semantic.*
# API call to get articles related to the topic
response = requests.get(f'https://api.pulsebit.com/v1/articles?topic={topic}&lang={lang}')
articles = response.json()
# Check the response
if response.status_code == 200:
print(f"Retrieved {len(articles)} articles related to {topic}.")
else:
print("Error fetching articles:", response.status_code)
Now that we have filtered the articles, we need to assess the narrative framing using the meta-sentiment moment. This involves running our cluster reason string back through the sentiment scoring API.
# Define the cluster reason string for meta-sentiment analysis
cluster_reason = "Clustered by shared themes: things, watch, markets, week, five."

# API call to score the sentiment of the narrative
sentiment_response = requests.post('https://api.pulsebit.com/v1/sentiment', json={'text': cluster_reason})
sentiment_score = sentiment_response.json()

# Check the sentiment score response
if sentiment_response.status_code == 200:
    print(f"Sentiment Score: {sentiment_score['score']}, Confidence: {sentiment_score['confidence']}")
else:
    print("Error fetching sentiment score:", sentiment_response.status_code)
Now that we have the code in place, let’s discuss three specific builds we can create using this pattern.
Investing Sentiment Signal: Set a threshold for momentum spikes like -0.341. When this threshold is reached, trigger alerts to your team. This allows you to act quickly on sentiment shifts that could impact your trading strategies.
Meta-Sentiment Loop: Use the cluster reason string to create a recurring analysis module in your pipeline that evaluates the framing of emerging themes. Specifically, focus on terms like “investing” and “markets” to gauge sentiment trends, thus enriching your understanding of market dynamics.
Geographic Origin Analysis: Build a dashboard that visualizes sentiment trends based on geographic origin. Using the geo filter, you can create comparative analyses between different regions and their sentiment towards topics like “investing” or “google.” This can help you identify localized trends that might influence broader market sentiment.
Getting started with our API is straightforward. Head over to pulsebit.lojenterprise.com/docs, and in under 10 minutes, you can copy, paste, and run these snippets to start catching sentiment leads that your competitors might overlook.

Top comments (0)