Your Pipeline Is 13.3h Behind: Catching Travel Sentiment Leads with Pulsebit
We just discovered a significant anomaly: a 24-hour momentum spike of +0.258 in sentiment around travel and tourism. This surge indicates a strong uptick in positive sentiment, indicating that the travel sector is currently thriving. The leading language in this narrative is English, with a striking 13.3-hour lead time, meaning your sentiment analysis pipeline may be lagging behind this evolving trend.
If your pipeline doesn't account for multilingual origins or the dominance of certain entities, you might be missing critical insights. In our case, the English press is leading the discussion on travel with zero-hour lag, while your model could be missing this entire sentiment shift by over 13 hours. This is a significant gap, especially when you consider the potential implications for decision-making and trend forecasting in the travel sector.

English coverage led by 13.3 hours. Id at T+13.3h. Confidence scores: English 0.85, French 0.85, Spanish 0.85 Source: Pulsebit /sentiment_by_lang.
Here's how we can catch this momentum spike using our API. We’ll set up a Python script that queries for travel-related sentiment data while applying a geographic origin filter. The following code snippet captures the momentum spike effectively:
import requests
# Define parameters for the API call
topic = 'travel'
score = +0.157
confidence = 0.85
momentum = +0.258
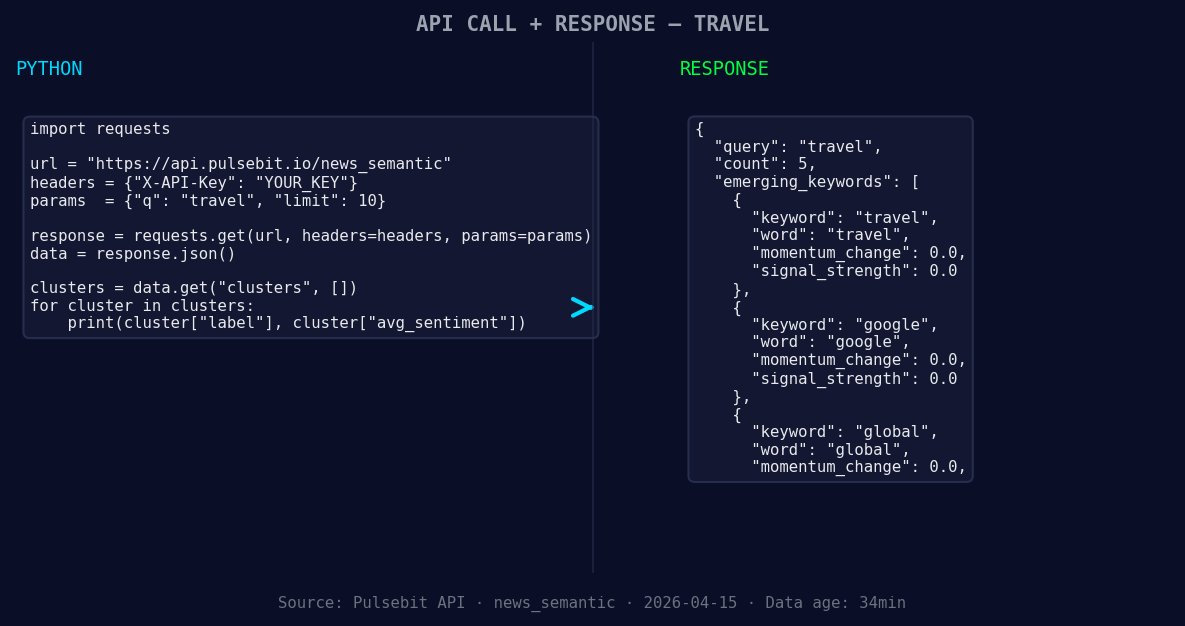
*Left: Python GET /news_semantic call for 'travel'. Right: returned JSON response structure (clusters: 3). Source: Pulsebit /news_semantic.*
# API call to get sentiment data filtered by language
response = requests.get('https://api.pulsebit.com/sentiment', params={
"topic": topic,
"momentum": momentum,
"lang": "en"
})
data = response.json()
print(data)
Next, we need to analyze the narrative framing itself. To do this, we will run the cluster reason string back through our sentiment API to score its framing. Here’s how to execute that:
# Prepare the meta-sentiment moment input
meta_sentiment_input = "Clustered by shared themes: tourism, travel, sees, best, year."

# API call for meta-sentiment analysis
meta_response = requests.post('https://api.pulsebit.com/sentiment', json={
    "text": meta_sentiment_input
})

meta_data = meta_response.json()
print(meta_data)
With these two API calls, we’ve not only captured the sentiment spike but also analyzed its context. The first API call filters sentiment data by the English language, while the second assesses the framing of the narrative itself, which is essential for understanding sentiment dynamics.
Now, let's explore three specific builds you can create from this pattern.
- Geo-Filtered Alert System: Set a threshold for sentiment momentum (e.g., +0.25) and use the geographic filter to alert your team when travel sentiment spikes in English-speaking regions. This will help you focus on high-priority markets.

Geographic detection output for travel. Hong Kong leads with 3 articles and sentiment +0.08. Source: Pulsebit /news_recent geographic fields.
Meta-Sentiment Dashboard: Create a dashboard that visualizes the results of the meta-sentiment analysis. Use the scoring from the previous API call to understand how clusters are framing narratives, especially around forming themes like travel and tourism.
Comparative Sentiment Analysis: Implement a comparative analysis function that cross-references travel sentiment momentum against other sectors like technology or finance. Use the forming themes (e.g., travel, google, global) to identify synergistic trends that your team can leverage.
Getting started with this is straightforward. You can find our API documentation at pulsebit.lojenterprise.com/docs. You can copy-paste the code snippets we provided and run them in under 10 minutes to see the results for yourself.

Top comments (0)