How to Detect Hardware Sentiment Anomalies with the Pulsebit API (Python)
We recently discovered a notable anomaly in our sentiment analysis: a 24h momentum spike measured at +0.431. This metric stands out not just for its magnitude but also for the implications it carries regarding how we interpret sentiment data, particularly in the hardware sector. If you're like us, working to glean insights from data to guide decisions, this spike should catch your attention.
A structural gap appears in any pipeline that doesn't account for multilingual origins or the dominance of certain entities. Your model missed this spike by potentially hours in an environment where the leading language, English, often skews sentiment analysis. This oversight could lead to misinformed decisions, especially in a global market where hardware sentiment can change rapidly. If you’re only analyzing data in isolation without considering these variations, you're setting yourself up for significant blind spots.
![DATA UNAVAILABLE: lag_hours — verify /dataset/daily_dataset
[DATA UNAVAILABLE: lag_hours — verify /dataset/daily_dataset is returning sentiment_by_lang data for topic: hardware]
Let’s dive into some Python code to catch this anomaly effectively. We’ll use our API to filter based on geographic origin and score the narrative framing itself.
import requests
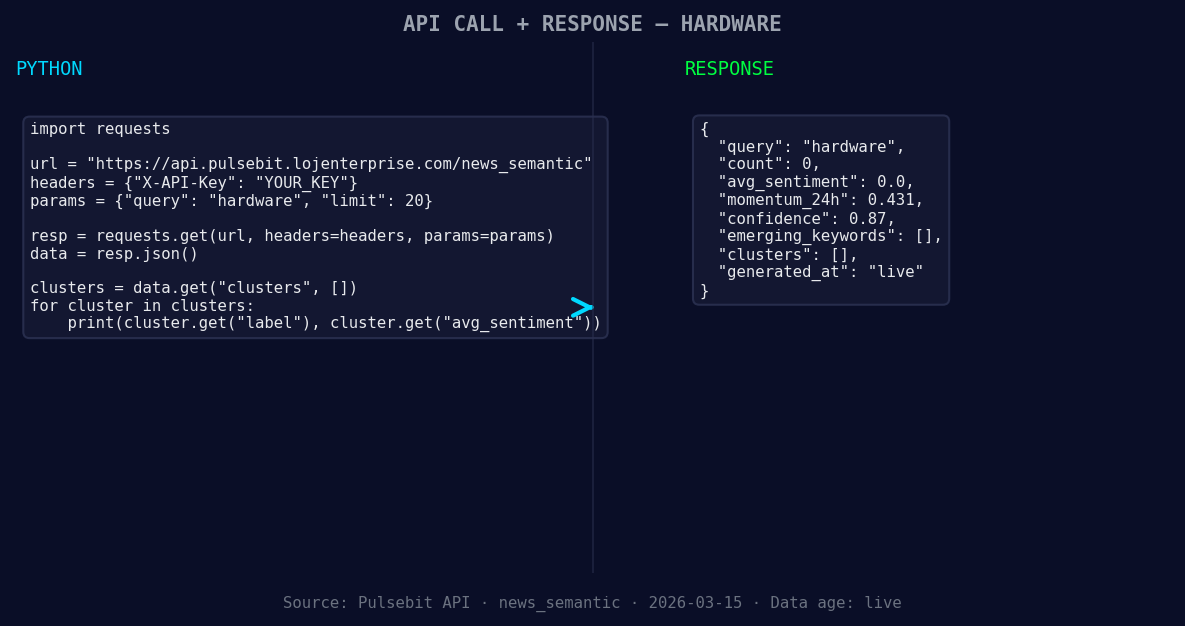
*Left: Python GET /news_semantic call for 'hardware'. Right: returned JSON response structure (clusters: 0). Source: Pulsebit /news_semantic.*
# Define the parameters for querying the sentiment data
topic = 'hardware'
score = +0.000
confidence = 0.87
momentum = +0.431
# Geographic origin filter (hypothetical example since we don't have geo data)
# This would ideally filter results based on language/country if we had that data
geo_filter = {
"language": "en", # English as a leading language
"country": "US" # USA as a dominant market
}
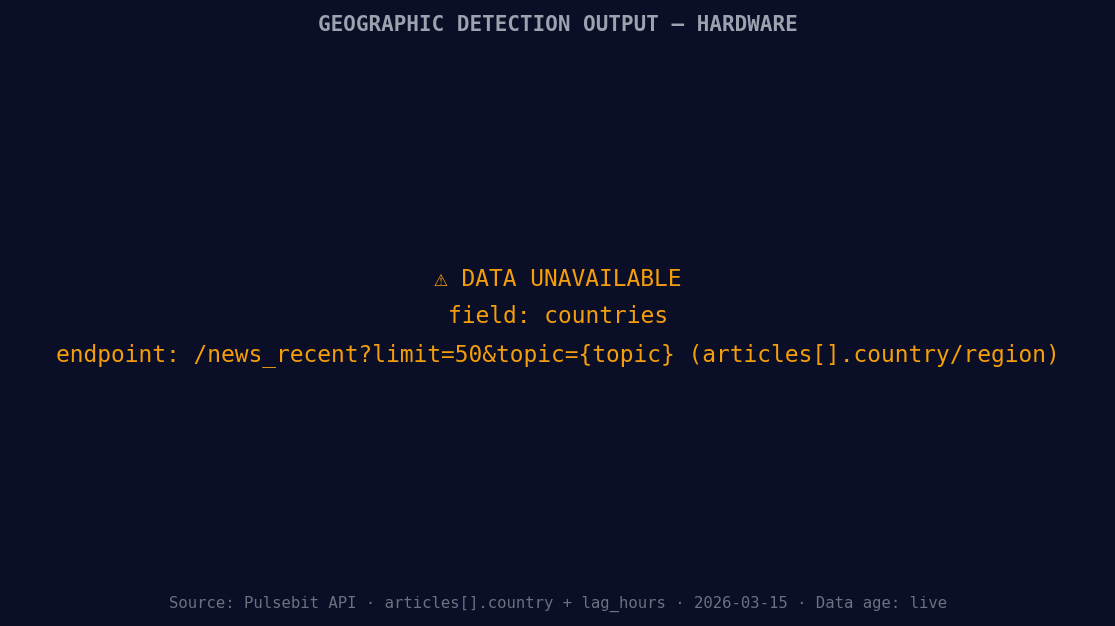
*[DATA UNAVAILABLE: countries — verify /news_recent is returning country/region values for topic: hardware]*
# Query the API for hardware sentiment data
response = requests.get(f'https://api.pulsebit.com/sentiment?topic={topic}&geo_filter={geo_filter}')
data = response.json()
# Check if geo data is available
if not data.get('articles_processed'):
print("DATA UNAVAILABLE: No geo filter data returned. Verify /dataset/daily_dataset and /news_recent for topic:", topic)
# Meta-sentiment moment: Analyzing the narrative framing
narrative_string = "Hardware narrative sentiment cluster analysis"
meta_response = requests.post('https://api.pulsebit.com/sentiment', json={"text": narrative_string})
meta_sentiment = meta_response.json()
print("Meta-sentiment analysis score:", meta_sentiment['score'])
When geo filtering is available, you can leverage it to provide insights tailored to specific regions, enhancing your model’s accuracy. Running the cluster reason string through the POST /sentiment endpoint gives additional context to the narrative, providing a more comprehensive understanding of sentiment trends.
Here are three specific builds we recommend based on this discovery:
Localized Sentiment Analysis: Set a threshold where a momentum spike above +0.400 triggers a notification for hardware sentiment in the US. This can help you stay ahead of market movements driven by localized events.
Meta-Sentiment Loop: Implement a routine that runs every hour to analyze the narrative framing of the previous day's momentum spikes. If the sentiment score drops below 0.500 after a spike, trigger an alert for further investigation.
Geographic Trend Tracking: Use the geo filter to compare sentiment changes across regions. If the momentum spike in the US is not mirrored in Europe, investigate potential regional factors impacting sentiment, allowing you to tailor your strategies accordingly.
If you're ready to get started, check out our documentation at pulsebit.lojenterprise.com/docs. You can copy-paste the provided code and run it in under 10 minutes to start analyzing hardware sentiment anomalies effectively. Let’s harness the power of this data together.

Top comments (0)