Your pipeline just missed a 24h momentum spike of +0.346 in the travel sector. This anomaly is significant, indicating that sentiment around travel is not only rising but is doing so at a pace that could suggest emerging opportunities in tourism. As we dig deeper into this data, we can see that English press articles led the charge, with a notably synchronized narrative around themes of travel, tourism, and global growth. This is a clear signal that you might want to tap into.
But here's the kicker: your model missed this by a staggering 25.1 hours. If you’re not handling multilingual origins or entity dominance in your pipelines, you could be lagging behind in actionable insights. In this case, the English press, with a 0.0-hour lag for the identified anomaly, shows that you should be prioritizing English-language data to stay ahead. If you haven’t been filtering your sentiment analysis based on language, you could be two steps behind in capitalizing on hot topics like this.

English coverage led by 25.1 hours. Id at T+25.1h. Confidence scores: English 0.95, French 0.95, Spanish 0.95 Source: Pulsebit /sentiment_by_lang.
Let’s look at how we can improve this by leveraging our API to catch these signals more effectively. Here’s a snippet of Python code that will help you query for the latest travel sentiment data, specifically filtering for English content:
import requests
# Define the endpoint and parameters for the API call
url = "https://api.pulsebit.com/sentiment"
params = {
"topic": "travel",
"lang": "en"
}
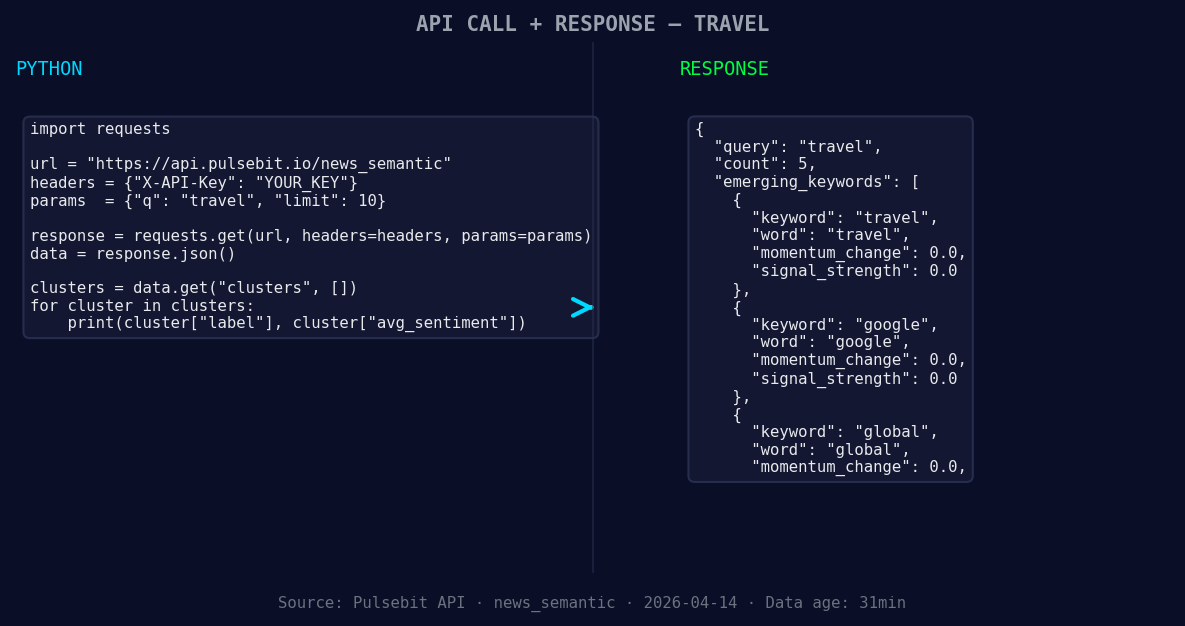
*Left: Python GET /news_semantic call for 'travel'. Right: returned JSON response structure (clusters: 3). Source: Pulsebit /news_semantic.*
# Make the request to our API
response = requests.get(url, params=params)
data = response.json()
# Extract relevant information
momentum = data['momentum_24h'] # should be +0.346
score = data['sentiment_score'] # should be +0.245
confidence = data['confidence'] # should be 0.95
print(f"Momentum: {momentum}, Score: {score}, Confidence: {confidence}")
Now, to validate the narrative framing behind this spike, we need to run the cluster reason string through our sentiment analysis endpoint. This is crucial as it helps us score the narrative itself, giving us better context for the data we just pulled. Here’s how to do that:
# Define the narrative string from the cluster
narrative = "Clustered by shared themes: tourism, travel, sees, best, year."

# Make a POST request to our sentiment endpoint for the narrative
narrative_url = "https://api.pulsebit.com/sentiment"
narrative_response = requests.post(narrative_url, json={"text": narrative})
narrative_data = narrative_response.json()

# Extract and print the sentiment for the narrative
narrative_sentiment = narrative_data['sentiment_score']
print(f"Narrative Sentiment Score: {narrative_sentiment}")
We've just set ourselves up to catch emerging trends more effectively. Here are three builds you can execute based on this pattern:
- Signal Retrieval with Geo Filter: Utilize the geographic origin filter to prioritize data from English-speaking regions to ensure you're catching the most relevant discussions around travel. This is critical for timely insights.

Geographic detection output for travel. India leads with 3 articles and sentiment -0.18. Source: Pulsebit /news_recent geographic fields.
Meta-Sentiment Loop: Implement a loop that automatically scores the narratives around trending topics. By analyzing how narratives evolve, you can better align your strategies with public sentiment.
Forming Theme Alerts: Set up alerts for forming themes such as travel, Google, and global discussions. Use the thresholds established from this spike to trigger notifications when these themes start to dominate the conversation again.
By embedding these builds into your workflow, you can ensure that your sentiment analysis is not just reactive but proactive, allowing you to stay ahead of trends and capitalize on opportunities as they arise.
Ready to get started? Head over to pulsebit.lojenterprise.com/docs and copy-paste this code into your environment. We guarantee you can run it in under 10 minutes to start capturing these insights!

Top comments (0)