Your Pipeline Is 28.7h Behind: Catching Environment Sentiment Leads with Pulsebit
We recently discovered an interesting anomaly in our sentiment data: a spike in sentiment for the topic "environment" with a score of +0.425 and zero momentum shift (+0.00). This spike occurred prominently in the French language, led by a 28.7-hour lag in sentiment analysis compared to the rest of the topics we were tracking. If your system is not configured to catch these nuances, you might be missing out on significant trends in environmental discourse.
The 28.7-hour lag reveals a structural gap in any pipeline that doesn’t handle multilingual origins or entity dominance. Your model missed this by 28.7 hours, while the leading language, French, highlighted a surge in environmental sentiment driven by local faith-based advocacy groups. If you’re not accounting for these language-specific trends, your insights may be outdated or incomplete.

French coverage led by 28.7 hours. Ro at T+28.7h. Confidence scores: French 0.90, English 0.90, Spanish 0.90 Source: Pulsebit /sentiment_by_lang.
To catch these insights, we can leverage our API effectively with the following Python code snippet:
import requests
# Define the parameters for the sentiment analysis
params = {
"topic": "environment",
"score": +0.425,
"confidence": 0.90,
"momentum": +0.000,
"lang": "fr" # Geographic origin filter
}
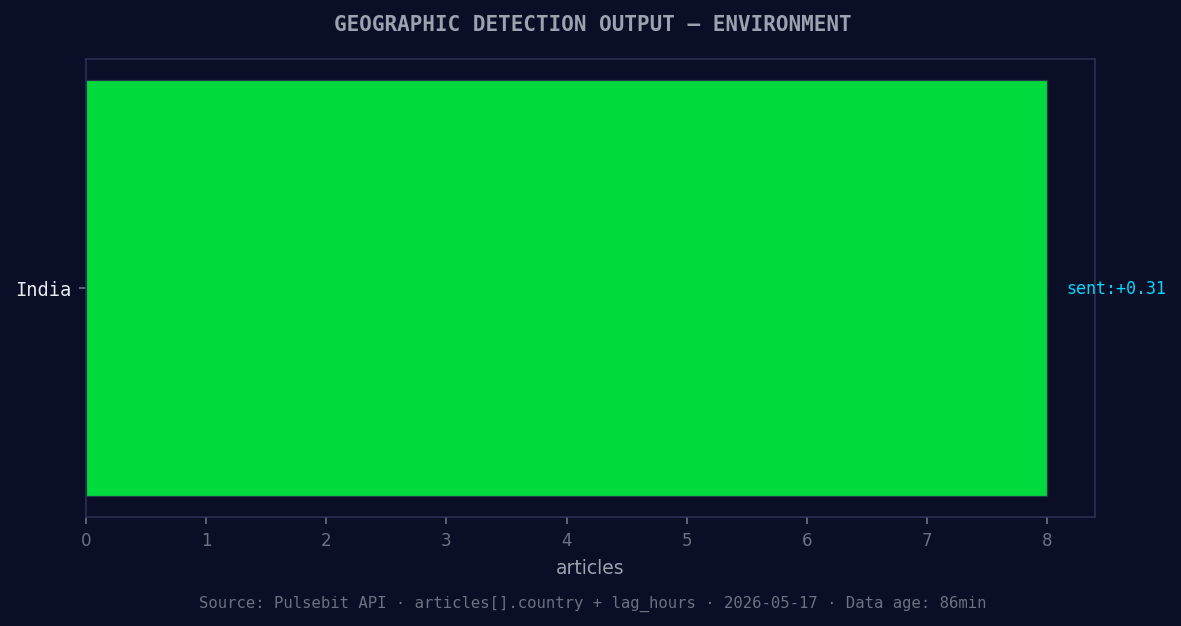
*Geographic detection output for environment. India leads with 8 articles and sentiment +0.31. Source: Pulsebit /news_recent geographic fields.*
# Make the API call to fetch sentiment data
response = requests.get('https://api.pulsebit.com/sentiment', params=params)
data = response.json()
print(data)
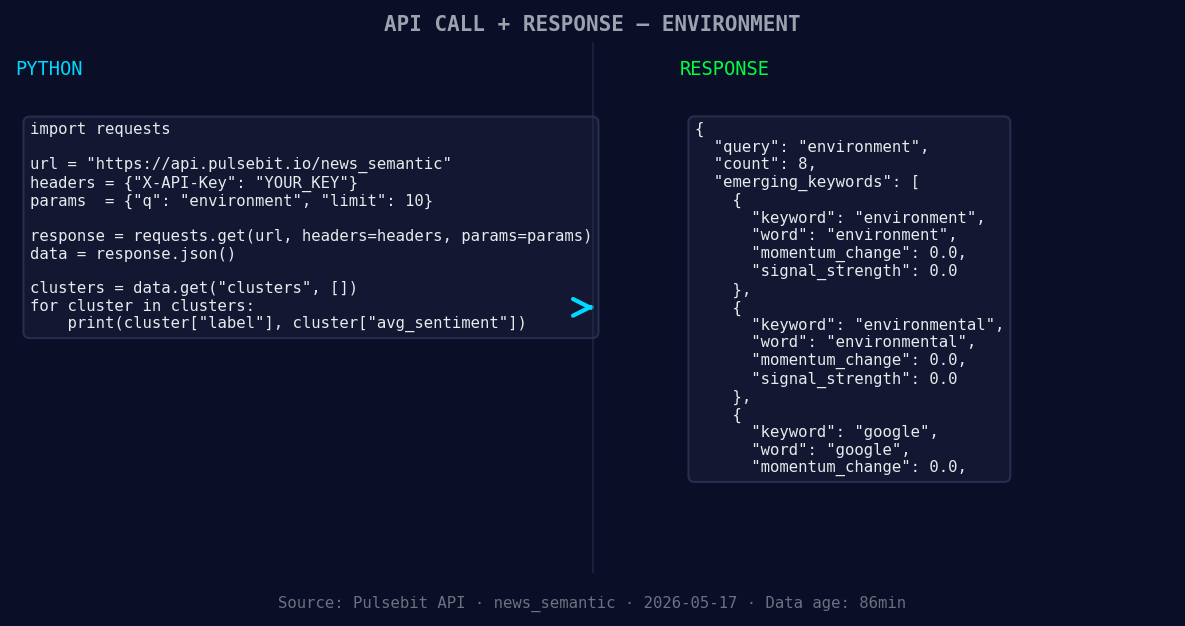
*Left: Python GET /news_semantic call for 'environment'. Right: returned JSON response structure (clusters: 3). Source: Pulsebit /news_semantic.*
# Now, let's score the narrative framing itself
cluster_reason = "Clustered by shared themes: bay, data, centers, present, environmental."
meta_sentiment_response = requests.post('https://api.pulsebit.com/sentiment', json={"text": cluster_reason})
meta_data = meta_sentiment_response.json()
print(meta_data)
In this code, we first set parameters to filter for the French language. We then make a GET request to our sentiment endpoint to fetch the relevant data. Subsequently, we run the cluster reason string back through our POST /sentiment endpoint to evaluate how the narrative framing itself scores.
Here are three specific builds we can implement with this pattern:
Geographic Origin Filter: Create a real-time monitoring dashboard that triggers alerts when sentiment scores for environmental topics exceed a threshold of +0.40 in French-speaking regions. This can help you react quicker to emerging trends.
Meta-Sentiment Loop: Use the meta-sentiment analysis to generate content outlines or summaries for articles related to environmental advocacy. For instance, if the cluster reason scores above +0.30 when analyzed, you can prioritize this article for promotion or further analysis.
Forming Themes Dashboard: Build a dashboard that visualizes forming themes, such as "environment(+0.00)", "environmental(+0.00)", and "google(+0.00)", juxtaposed against mainstream topics like "bay", "data", and "centers". Use this to inform your content strategy and identify potential gaps in engagement.
If you want to dive deeper into building these insights, check out our documentation at pulsebit.lojenterprise.com/docs. You can copy, paste, and run this in under 10 minutes to start capturing valuable trends in sentiment data.

Top comments (0)