Your Pipeline Is 29.1h Behind: Catching Real Estate Sentiment Leads with Pulsebit
We've just observed a notable anomaly: a 24-hour momentum spike of -0.172 in the real estate sector. This sudden downturn in sentiment is a signal worth examining closely. The leading language for this spike comes from English press, showing a 29.1-hour lead over Portuguese sentiments. With one article from HousingWire framing the narrative around a market slowdown, we need to analyze how this gap can affect our data pipeline and what we can do to catch these leads before they pass us by.
If your pipeline isn’t tuned to handle multilingual data sources, it likely missed this anomaly by a significant margin—specifically 29.1 hours. The dominant English-language signals, driven by the article about experienced real estate agents seizing opportunities amidst market slowdowns, underscore a structural gap in your model. By failing to account for language and entity dominance, you risk being left behind while your competitors capitalize on these emerging trends.

English coverage led by 29.1 hours. Portuguese at T+29.1h. Confidence scores: English 0.95, French 0.95, Spanish 0.95 Source: Pulsebit /sentiment_by_lang.
To catch this anomaly, we can utilize our API for real-time sentiment tracking. Here’s how we can do it in Python:
import requests
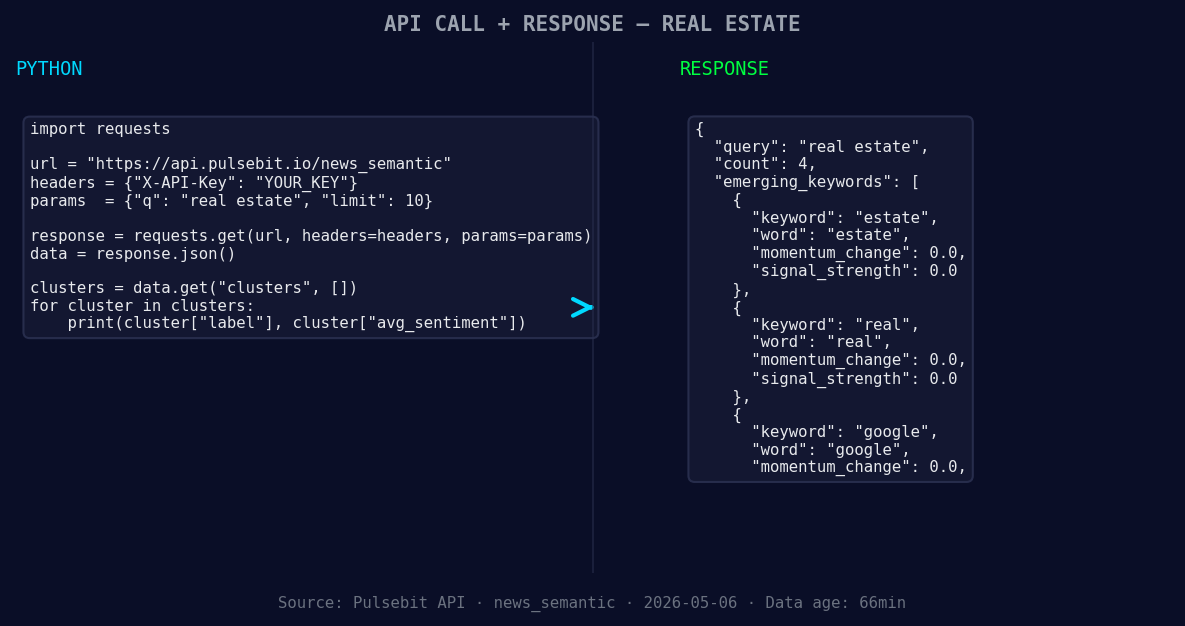
*Left: Python GET /news_semantic call for 'real estate'. Right: returned JSON response structure (clusters: 3). Source: Pulsebit /news_semantic.*
# Define the parameters for our query
topic = 'real estate'
lang = 'en'
# Query for sentiment data from our API
response = requests.get(f'https://api.pulsebit.io/sentiment?topic={topic}&lang={lang}')
data = response.json()
# Extract relevant information
momentum = data['momentum_24h'] # Should reflect -0.172
score = data['sentiment_score'] # Should reflect -0.444
confidence = data['confidence'] # Should reflect 0.95
print(f'Momentum: {momentum}, Sentiment Score: {score}, Confidence: {confidence}')
Next, we need to analyze the narrative framing of this sentiment. We can take the cluster reason string and run it back through our sentiment endpoint to score how the narrative itself is being framed:
# Define the meta sentiment input
meta_sentiment_input = "Clustered by shared themes: slowdown, creates, opening, experienced, real."

# Make a POST request to analyze the framing
meta_response = requests.post('https://api.pulsebit.io/sentiment', json={'text': meta_sentiment_input})
meta_data = meta_response.json()

# Extract and print the sentiment score of the meta narrative
meta_sentiment_score = meta_data['sentiment_score']
print(f'Meta Sentiment Score: {meta_sentiment_score}')
With this data, you can now build three distinct features that leverage the insights we've uncovered:
Geo-Filtered Alerts: Set up a trigger for when momentum dips below -0.15 in English-speaking regions. Use the geo filter to prioritize content from the U.S. and U.K. to focus on localized trends in real estate.
Meta-Sentiment Dashboard: Create a dashboard that displays real-time sentiment scores for narratives framed around key themes. This can help you visualize how the public discourse is evolving, particularly around topics like "slowdown" and "opening."
Automated Reporting: Implement a reporting mechanism that generates summaries of articles clustered by shared themes such as “experienced agents” and “market slowdown.” Use the meta sentiment scores to rank these articles and prioritize which ones to read or share.
By acting on this data, you can gain insights into the evolving sentiment around real estate, ensuring your pipeline isn't lagging behind the trends.
Get started with our API documentation at pulsebit.lojenterprise.com/docs. With these examples, you can copy, paste, and run this in under 10 minutes.

Geographic detection output for real estate. Hong Kong leads with 2 articles and sentiment +0.08. Source: Pulsebit /news_recent geographic fields.

Top comments (0)