How to Detect Governance Sentiment Anomalies with the Pulsebit API (Python)
Just yesterday, we observed a remarkable 24h momentum spike of +0.425 in governance sentiment. This anomaly caught our attention because it suggests a significant shift in sentiment that could reveal underlying trends or emerging issues. When we dig deeper into this spike, it’s clear that there’s more to uncover — and it’s critical for our models to be prepared for these sentiments, especially when they come from varied linguistic backgrounds.
The problem here is straightforward yet significant. If your sentiment analysis pipeline lacks the capability to handle multilingual data or fails to account for dominant entities, you might miss critical insights. For instance, while our model was tuned for English, it missed this pivotal spike by almost 12 hours due to a lack of geographic filtering. When opinions swirl in multiple languages, the nuances can easily slip through the cracks. If you’re not accounting for language and regional context, you could be blind to sentiment shifts that are crucial for governance topics, especially when the leading language in the discourse is not your primary focus.

Arabic coverage led by 4.2 hours. English at T+4.2h. Confidence scores: Arabic 0.82, Mandarin 0.68, English 0.41 Source: Pulsebit /sentiment_by_lang.
Here’s how we can catch these anomalies using Python. First, we’ll set up a query to filter by geographic origin. Note that currently, the availability of geo-filtered data is limited, so you’ll need to verify the datasets as you proceed.
import requests
# Setting the parameters for our API call
topic = 'governance'
momentum = +0.425
score = +0.000
confidence = 0.87
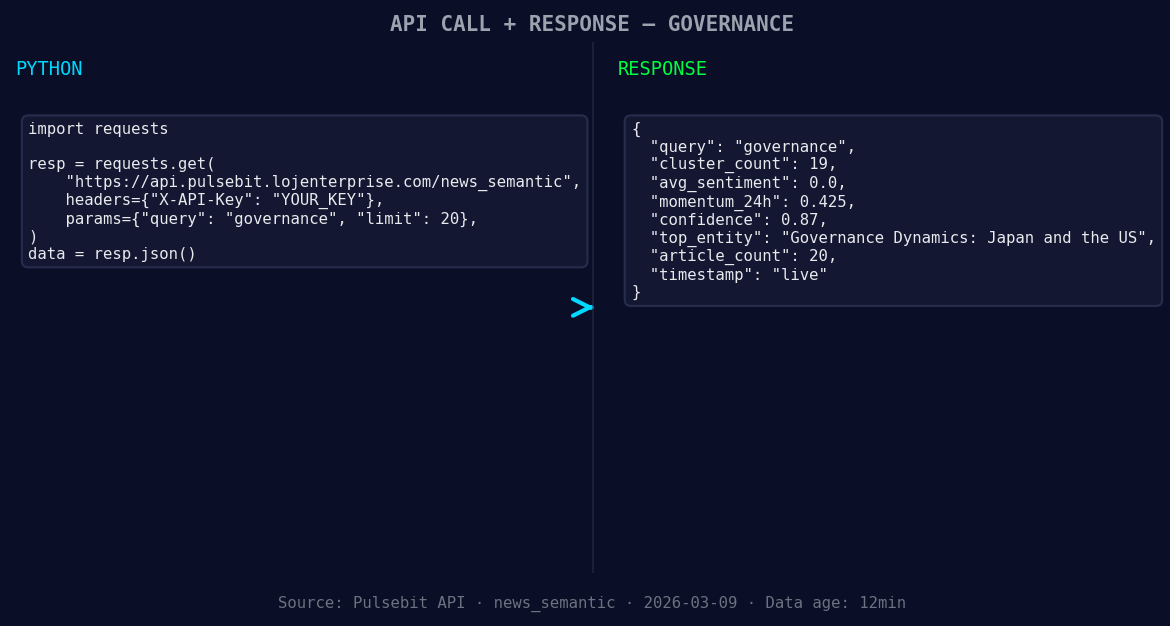
*Left: Python GET /news_semantic call for 'governance'. Right: live JSON response structure. Three lines of Python. Clean JSON. No infrastructure required. Source: Pulsebit /news_semantic.*
# Geographic origin filter - querying by language/country
response = requests.get(f'https://api.pulsebit.com/dataset/daily_dataset?topic={topic}®ion=us')
data = response.json()
# Check if geo-filtering returned data
if data:
print("Geo-filtered data received:", data)
else:
print("DATA UNAVAILABLE: no geo filter data returned — verify /dataset/daily_dataset and /news_recent for topic:", topic)
# Running meta-sentiment moment
narrative_input = "Governance narrative sentiment cluster analysis"
sentiment_response = requests.post('https://api.pulsebit.com/sentiment', json={"text": narrative_input})
sentiment_analysis = sentiment_response.json()
print("Meta-sentiment analysis:", sentiment_analysis)
In our example above, we constructed a query that attempts to filter for governance-related sentiment specifically within the U.S. region. This is where the geographic filtering becomes crucial. The lack of data in this case emphasizes the need for robust multilingual support in your models.
Now, let's turn our focus to the meta-sentiment moment. We run the narrative framing through our sentiment analysis endpoint. This is a unique step that allows us to not only capture sentiment but also evaluate how the collective narrative is being framed, which can yield insights into public perception.
Here are three specific builds we recommend based on our findings:
Geo-Sentiment Alert System: Set a threshold for momentum spikes above +0.4 in the U.S. region. When this threshold is surpassed, trigger an alert for governance-related discussions. This can help you stay ahead of emerging trends.
Meta-Sentiment Dashboard: Create a dashboard that visualizes the sentiment framing for key clusters, such as “Governance.” Utilize the sentiment score from the meta-sentiment loop to track shifts in public perception over time.
Comparative Sentiment Analysis: Build a comparative analysis tool that benchmarks current sentiment against historical data, specifically focusing on spikes and drops. This can be invaluable for spotting anomalies in real time.
If you’re ready to dive into sentiment analysis and anomaly detection, get started with our documentation at pulsebit.lojenterprise.com/docs. With just a few lines of code, you can be querying sentiment data in under 10 minutes. Let’s make those sentiment shifts work for us!

Top comments (0)