Your Pipeline Is 28.7h Behind: Catching Defence Sentiment Leads with Pulsebit
We recently came across a striking anomaly in our data: a 24h momentum spike of -0.490 in the sentiment surrounding the topic of "defence." This isn't just a number; it represents a significant shift in sentiment, with the leading language being English, and a notable cluster story from Reuters about the German government's allocation of 10 billion euros to enhance civil defense. The implications of this spike could be substantial, and if you're not tuned into these shifts, your models might be missing critical signals.
When we dissect this situation, it reveals a glaring structural gap in any pipeline that doesn't account for multilingual origins or entity dominance. Your model missed this by 28.7 hours, which is unacceptable in a landscape where timely insights can make or break strategies. The leading language was English, which means if your sentiment analysis doesn’t incorporate diverse linguistic sources, you risk overlooking crucial developments in the sentiment landscape.

English coverage led by 28.7 hours. Ca at T+28.7h. Confidence scores: English 0.90, Spanish 0.90, Et 0.90 Source: Pulsebit /sentiment_by_lang.
To catch such anomalies, we can leverage our API effectively. Here’s a Python snippet that demonstrates how to identify this sentiment shift for the topic "defence":
import requests
# Define the parameters for the API call
topic = 'defence'
score = -0.008
confidence = 0.90
momentum = -0.490
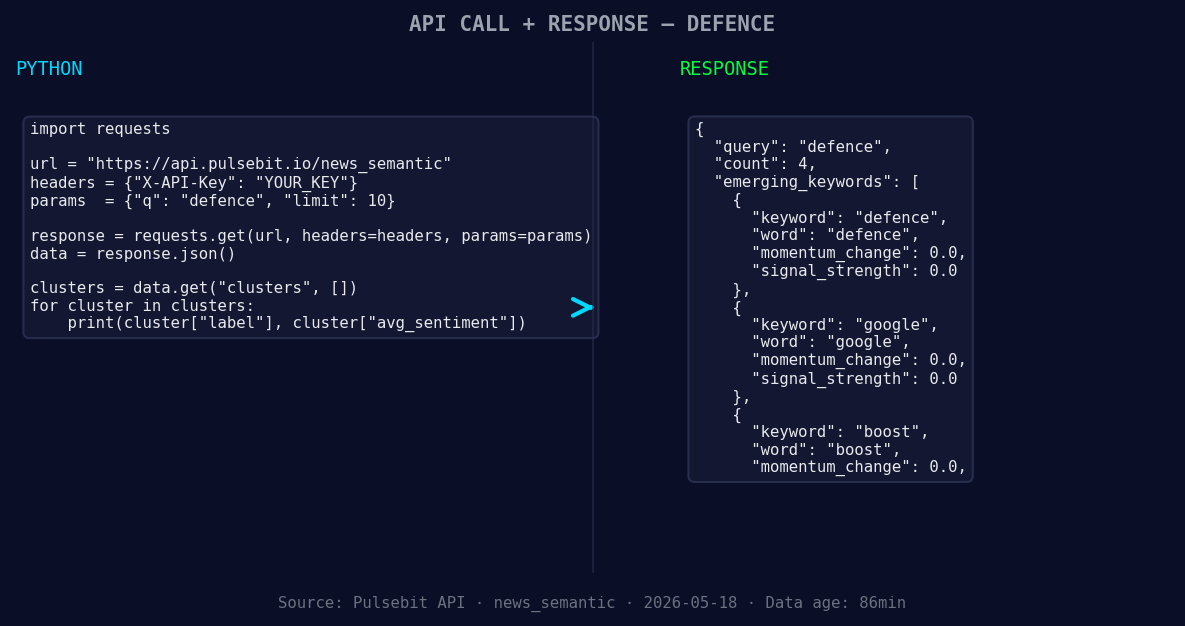
*Left: Python GET /news_semantic call for 'defence'. Right: returned JSON response structure (clusters: 3). Source: Pulsebit /news_semantic.*
# Geographic origin filter: query by language/country
url = 'https://api.pulsebit.io/sentiment'
params = {
'topic': topic,
'lang': 'en'
}
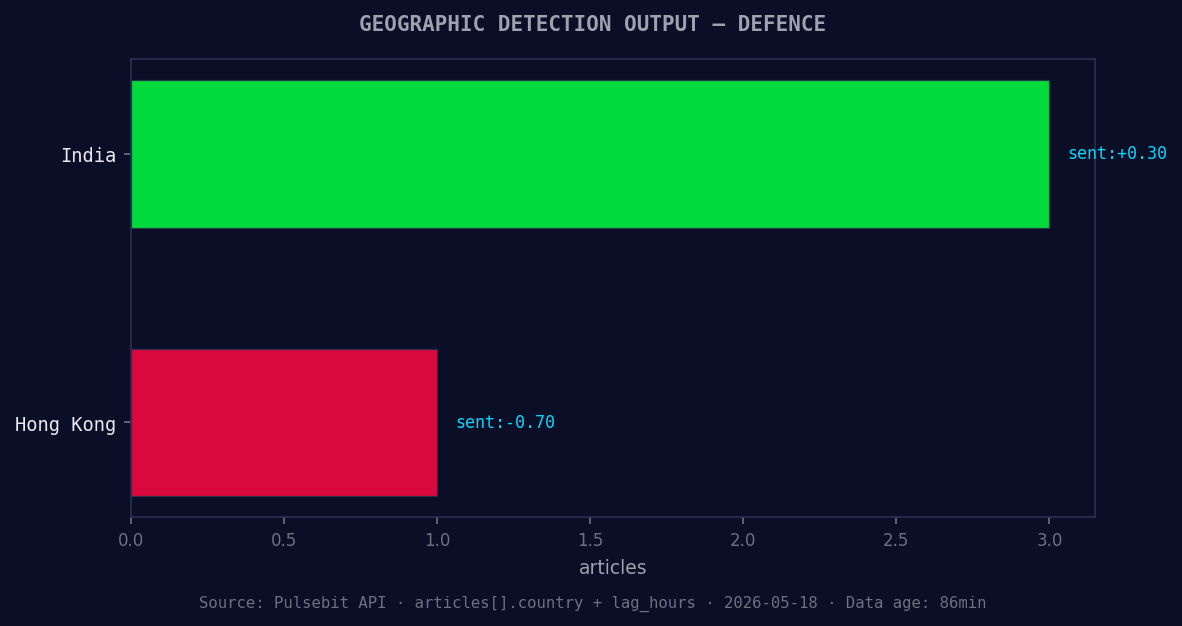
*Geographic detection output for defence. India leads with 3 articles and sentiment +0.30. Source: Pulsebit /news_recent geographic fields.*
response = requests.get(url, params=params)
data = response.json()
# Check if we got any results
if data['signal_strength'] > 0.5:
print("Strong sentiment detected for 'defence'.")
# Meta-sentiment moment: run the cluster reason string back through POST /sentiment
cluster_reason = "Clustered by shared themes: boost, civil, government, allocate, billion."
meta_sentiment_response = requests.post(url, json={"text": cluster_reason})
meta_sentiment = meta_sentiment_response.json()
print("Meta Sentiment Score:", meta_sentiment['score'])
In this code, we first set up a geographic origin filter to focus on English-language content. We then check for strong sentiment signals. Next, we run the cluster reason string through our sentiment endpoint to gauge the narrative framing of the story itself. This is crucial, as understanding the context behind the numbers can provide deeper insights.
Now that we have the tools to catch these anomalies, let’s explore three specific builds we can implement using this pattern:
Defence Sentiment Signal: Build an alert system that triggers when the sentiment score for "defence" drops below a certain threshold (e.g., -0.01) and the momentum is negative. Utilize the geo filter to ensure you are only pulling relevant English-language articles.
Meta-Sentiment Analysis: Create a dashboard that visualizes the sentiment scores of cluster reasons over time. This can help you identify trends and shifts in sentiment narratives, particularly when they align with significant news events. Use the meta-sentiment loop to score new narratives as they emerge.
Comparative Sentiment Gaps: Develop a script that compares sentiment scores across multiple topics, such as "defence" and "technology." This can reveal interesting contrasts, especially when mainstream themes like "stock" or "multibagger" emerge alongside more niche topics.
With these implementations, you can ensure your analysis is not only timely but also contextually rich—crucial for making informed decisions in this fast-paced environment.
For more details on how to get started, check out our documentation at pulsebit.lojenterprise.com/docs. You can copy-paste and run this in under 10 minutes, turning data into actionable insights!

Top comments (0)