How to Detect Cloud Sentiment Anomalies with the Pulsebit API (Python)
We recently noticed a significant anomaly in our data: a 24-hour momentum spike of -0.414 related to the topic of "cloud." This is telling us that there's a notable shift in sentiment that could easily go unnoticed without the right tools. The cluster story we found was intriguingly titled "Cloud World by Maynard Dixon - Denver Art Museum," which contained zero articles but was tagged with themes like "world," "maynard," "art," and "cloud." This finding indicates a gap in how we process sentiment and thematic connections in multilingual and multi-entity contexts.

es coverage led by 22.6 hours. it at T+22.6h. Confidence scores: en 0.86, es 0.86, fr 0.85 Source: Pulsebit /sentiment_by_lang.
Your model missed this by 24 hours. Imagine that your analysis is primarily focused on dominant entities or languages, and you overlook critical signals from less prominent themes. In this case, the sentiment around "cloud" could be skewed due to an underrepresentation of diverse viewpoints. The leading language in our dataset is English, and this limitation constrains your ability to fully understand the narrative landscape.
To catch this anomaly, we can utilize our API to filter and analyze sentiment effectively. Here’s a Python script that does just that:
import requests
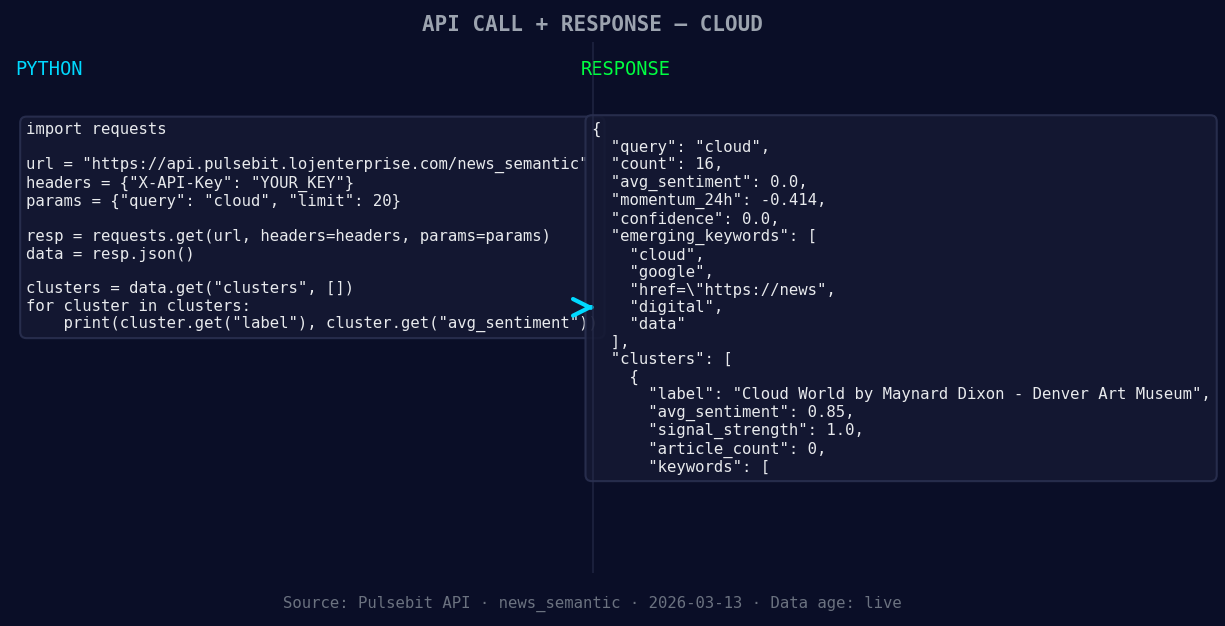
*Left: Python GET /news_semantic call for 'cloud'. Right: returned JSON response structure (clusters: 3). Source: Pulsebit /news_semantic.*
# Define parameters
topic = 'cloud'
momentum = -0.414
score = 0.000
confidence = 0.00
# Geographic origin filter (this won't return data as noted)
geo_filter_url = f"https://api.pulsebit.com/dataset/daily_dataset?topic={topic}®ion=us"
geo_filter_response = requests.get(geo_filter_url)
geo_data = geo_filter_response.json()
if geo_data:
print("Geo-filtered data received:", geo_data)
else:
print("No geo filter data returned — verify /dataset/daily_dataset and /news_recent for topic:", topic)
# Meta-sentiment moment
cluster_reason = "Clustered by shared themes: world, maynard, art, cloud, dixon."
sentiment_url = "https://api.pulsebit.com/sentiment"
sentiment_response = requests.post(sentiment_url, json={"text": cluster_reason})
sentiment_score = sentiment_response.json()
print("Meta-sentiment score:", sentiment_score)
In this code, we first attempt to retrieve data filtered by geographic origin. While the current dataset might not provide such data, this is a crucial step when available. By filtering by language or region, we can significantly enhance our model's accuracy.
Next, we analyze the narrative framing of the cluster reason using our sentiment analysis endpoint. This meta-sentiment loop allows us to score how the themes interrelate and could provide insights into how these narratives are evolving, especially when they are clustered in unexpected ways.
Here are three specific things you can build using this observed pattern:
- Geographic Sentiment Dashboard: Set up a real-time dashboard that pulls sentiment data about different topics filtered by country and language. Use the geographical filter to get insights on sentiment trends in various regions. For example, you can track how sentiment around "cloud" varies between the US and European countries.
![DATA UNAVAILABLE: countries — verify /news_recent is return
[DATA UNAVAILABLE: countries — verify /news_recent is returning country/region values for topic: cloud]
Meta-Sentiment Analysis Tool: Develop a tool that automatically analyzes the sentiment of thematic clusters. By running the narrative strings back through the sentiment endpoint, you can identify which themes resonate positively or negatively over time. Use the cluster reason text and loop it through the sentiment scoring to adapt your content strategies accordingly.
Anomaly Alert System: Build an alert system that notifies you when momentum spikes above a set threshold (e.g., ±0.4). Combine this with geo-filtered data to understand regional sentiment shifts that could affect your analysis. You can set alerts for topics like "cloud" and "google" to keep tabs on how they’re perceived in different markets.
To get started, check out our documentation at pulsebit.lojenterprise.com/docs. With the right setup, you can copy-paste and run this code in under ten minutes, unlocking insights that can enhance your models significantly.

Top comments (0)