Your Pipeline Is 29.2h Behind: Catching Cloud Sentiment Leads with Pulsebit
We recently observed a striking anomaly: a 24-hour momentum spike of -0.223 in the sentiment surrounding the topic of "cloud." This spike correlates with a significant event reported in English news, particularly around the weather relief brought by rain and hailstorms in Hyderabad. With a leading language lag of 29.2 hours, it’s clear that if you’re relying solely on traditional pipelines, you might be missing critical insights.

English coverage led by 29.2 hours. Af at T+29.2h. Confidence scores: English 0.85, Spanish 0.85, French 0.85 Source: Pulsebit /sentiment_by_lang.
The challenge here is that standard sentiment pipelines often overlook the nuances of multilingual origin and entity dominance. Your model missed this sentiment shift by over 29 hours, which means you’ve been operating with outdated information. This lag can lead to missed opportunities in understanding market dynamics, particularly in cases where a specific event has a cascading effect on related topics, like "cloud" in this instance.
To catch this anomaly in real-time, we can leverage our API effectively. Here’s a straightforward implementation using Python to track the sentiment around "cloud" and validate the narrative framing through meta-sentiment.
import requests
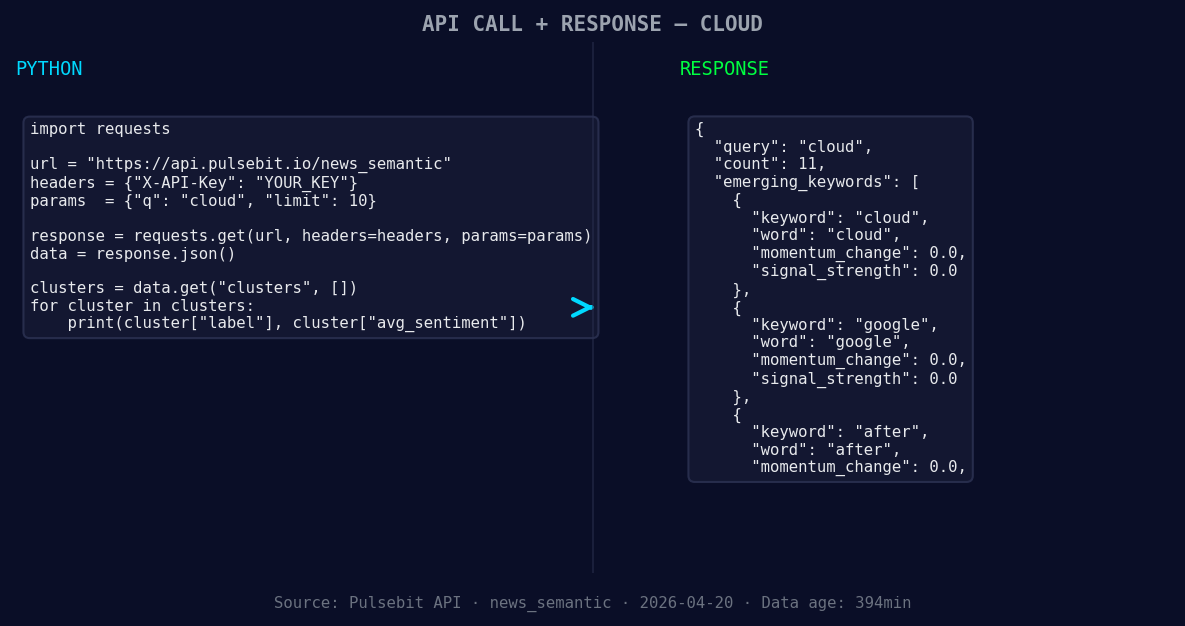
*Left: Python GET /news_semantic call for 'cloud'. Right: returned JSON response structure (clusters: 3). Source: Pulsebit /news_semantic.*
# Geographic origin filter: query by language/country
geographic_filter = {
"lang": "en",
"topic": "cloud",
"momentum": -0.223
}
response = requests.get('https://api.pulsebit.com/sentiment', params=geographic_filter)
data = response.json()
print("Sentiment Data:", data)
# Meta-sentiment moment: scoring the narrative framing
narrative = "Clustered by shared themes: sudden, rain, hailstorm, bring, relief."
meta_response = requests.post('https://api.pulsebit.com/sentiment', json={"text": narrative})
meta_sentiment_data = meta_response.json()
print("Meta-Sentiment Score:", meta_sentiment_data)
In this code, we first set up a geographic filter to focus on English-language articles related to "cloud." This allows us to capture the sentiment accurately. Then, we send a second request to our API to analyze the narrative framing around the clustered themes, which helps us understand the context better.

Geographic detection output for cloud. Hong Kong leads with 5 articles and sentiment +0.32. Source: Pulsebit /news_recent geographic fields.
Now, let’s look at three actionable builds we can create using this sentiment pattern:
Signal Detection for Cloud Sentiment: Set an alert threshold for sentiment scores below +0.600 when the momentum is trending negatively (e.g., -0.223). This can help you detect emerging trends in the cloud sector, allowing you to act promptly.
Geo-Filtered Updates: Use the geographic filter to monitor sentiment shifts in specific regions. You could configure a function that triggers a notification whenever sentiment around "cloud" drops below a specified score in English-language sources, focusing on immediate areas affected by weather changes.
Meta-Sentiment Analysis Dashboard: Build a dashboard using the meta-sentiment scores derived from narrative analyses. Display trending themes, such as "sudden," "rain," "hailstorm," and "relief," to visualize how these narratives evolve over time alongside sentiment shifts, helping you align your strategies accordingly.
By implementing these builds, you can bridge the gap caused by lagging sentiment data, ensuring that you stay ahead in a rapidly changing information landscape.
Ready to dive in? Check out our documentation for more details. With just a few lines of code, you can run these analyses and start capturing insights in under 10 minutes.

Top comments (0)