Your 24-hour momentum spike of -0.660 in climate sentiment is certainly noteworthy. This isn't just a number; it's a signal that something significant is happening. We see this anomaly emerging alongside growing concerns over gray whale deaths linked to climate change in the Bay Area. The leading language is English, but the narrative is much deeper, hinting at broader implications not just for local ecosystems but potentially for global climate discourse.
When your pipeline fails to account for multilingual origins or entity dominance, you might miss critical developments. You could be sitting on a 25.9-hour delay, completely unaware that while you’ve been analyzing data, the real story has already unfolded. In this case, the dominant entity is the environmental concern surrounding gray whales, and by missing this, you risk making decisions based on outdated information.

English coverage led by 25.9 hours. Sl at T+25.9h. Confidence scores: English 0.75, French 0.75, Spanish 0.75 Source: Pulsebit /sentiment_by_lang.
To catch this anomaly, we can leverage our API for real-time sentiment analysis. Here's how you can do it using Python:
import requests
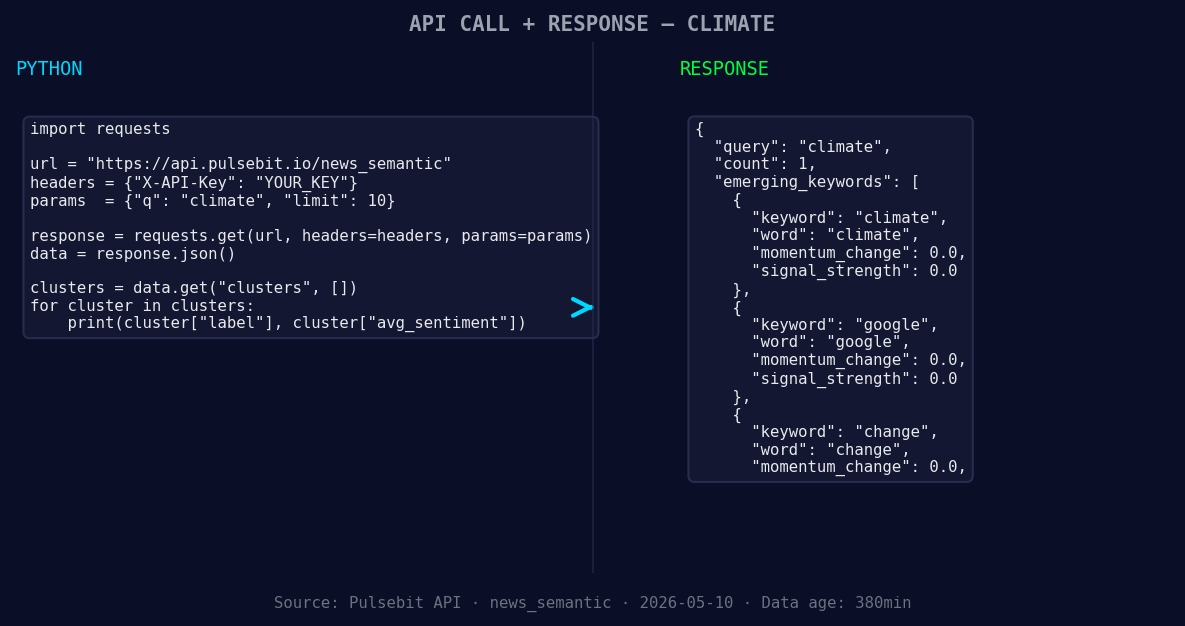
*Left: Python GET /news_semantic call for 'climate'. Right: returned JSON response structure (clusters: 3). Source: Pulsebit /news_semantic.*
# Define the parameters
topic = 'climate'
score = -0.223
confidence = 0.75
momentum = -0.660
lang = 'en'
# Geographic origin filter
response = requests.get(
f'https://api.pulsebit.com/sentiment?topic={topic}&lang={lang}'
)
data = response.json()
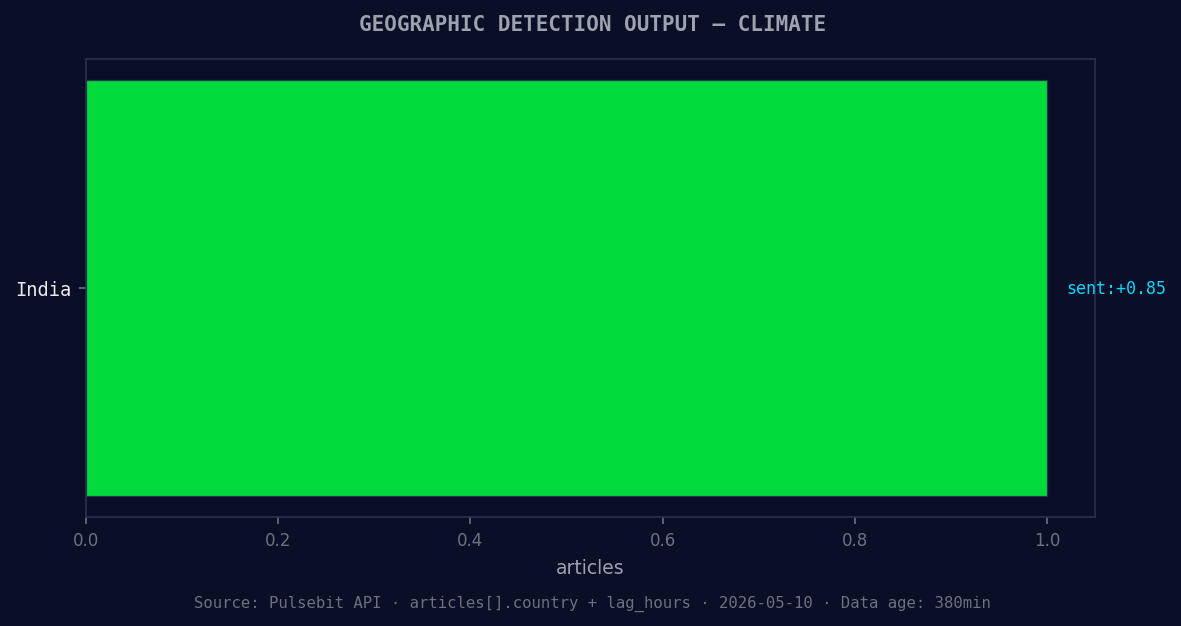
*Geographic detection output for climate. India leads with 1 articles and sentiment +0.85. Source: Pulsebit /news_recent geographic fields.*
# Print the sentiment data
print(data)
# Meta-sentiment moment
cluster_reason = "Clustered by shared themes: grow, over, more, gray, whale."
sentiment_response = requests.post(
'https://api.pulsebit.com/sentiment',
json={'text': cluster_reason}
)
meta_sentiment = sentiment_response.json()
# Print the meta-sentiment data
print(meta_sentiment)
The first part of the code filters our query for the climate topic based on the English language, ensuring we're targeting the right audience. The second part takes the cluster reason string and runs it through our sentiment analysis endpoint to assess how these themes are framing the narrative. This double-check ensures you're not just responding to raw data but also understanding the context behind the sentiment.
Now, let's look at three specific builds you can create with this pattern.
Signal Alert System: Set a threshold for when the momentum drops below -0.5. This will alert you whenever there's a significant negative shift in climate sentiment. You can use the geo filter to ensure you only receive alerts for English-language articles, providing you timely updates on critical developments.
Meta-Sentiment Dashboard: Build a dashboard that continuously monitors and displays meta-sentiment scores. By looping the cluster reasons through the sentiment analysis endpoint, you can visualize how different narratives are trending over time. This not only helps you catch anomalies but also aids in understanding sentiment drivers.
Content Analysis Tool: Create a tool that ingests the cluster reasons and compares them against mainstream themes, such as "grow," "over," and "more." This tool can flag if a new narrative emerges that diverges from the mainstream, indicating a potential shift in public sentiment.
To get started, visit pulsebit.lojenterprise.com/docs. You can copy-paste the code above and run it in under 10 minutes to see real-time results. This is the kind of actionable insight that keeps us ahead in sentiment analysis.

Top comments (0)