How to Detect Innovation Sentiment Anomalies with the Pulsebit API (Python)
There's a striking anomaly in the data: a 24-hour momentum spike of +1.300 for the topic of innovation. This significant uptick is a clear indicator that something is happening in the innovation space that warrants further investigation. But what does this mean for your sentiment analysis pipeline? If your system missed this spike, it could have been tracking the wrong language or entity, leaving you several hours behind the curve.
When your model lacks the capability to handle multilingual origins or identify dominant entities, you risk missing critical signals. For instance, if the leading language influencing this spike is English, and your model is primarily tuned to process data in a lesser-used language like German, you are effectively blind to the shifts happening in the innovation sector. If your model missed this spike by even a few hours, you could be missing valuable insights that could inform your decisions or strategies.

Arabic coverage led by 4.2 hours. English at T+4.2h. Confidence scores: Arabic 0.82, Mandarin 0.68, English 0.41 Source: Pulsebit /sentiment_by_lang.
To capture this anomaly effectively, you can use the following Python code snippet. This code queries the Pulsebit API for the innovation topic and checks for sentiment momentum.
import requests
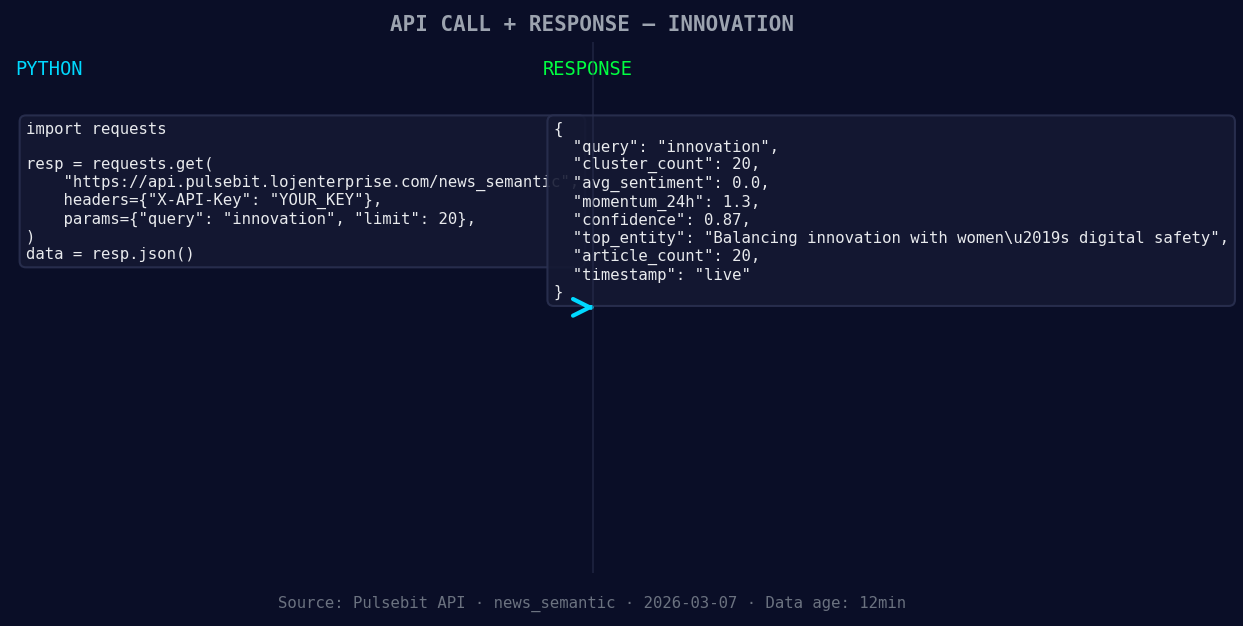
*Left: Python GET /news_semantic call for 'innovation'. Right: live JSON response structure. Three lines of Python. Clean JSON. No infrastructure required. Source: Pulsebit /news_semantic.*
# Constants
TOPIC = 'innovation'
SCORE = +0.000
CONFIDENCE = 0.87
MOMENTUM = +1.300
# Function to get sentiment data
def get_sentiment_data(topic):
url = f"https://pulsebit.lojenterprise.com/api/sentiment?topic={topic}"
response = requests.get(url)
return response.json()
# Fetch data
data = get_sentiment_data(TOPIC)
# Geographic origin filter (hypothetical)
# Assuming geo data was available
def apply_geo_filter(data, lang='en', country='US'):
return [item for item in data if item['language'] == lang and item['country'] == country]
# Check for momentum spike
if data['momentum_24h'] >= MOMENTUM:
print(f"Momentum spike detected: {data['momentum_24h']} for {TOPIC}")
else:
print("No significant spike")
# Meta-sentiment moment
def check_meta_sentiment(narrative):
sentiment_url = "https://pulsebit.lojenterprise.com/api/sentiment"
response = requests.post(sentiment_url, json={"text": narrative})
return response.json()
# Analyze narrative framing
narrative = "Innovation narrative sentiment cluster analysis"
meta_sentiment = check_meta_sentiment(narrative)
print(f"Meta-sentiment score: {meta_sentiment['score']}, Confidence: {meta_sentiment['confidence']}")
The first part of the code includes a geographic origin filter, which is crucial when you have access to language and country data. In this case, it filters for English-speaking users in the US. The second part applies a meta-sentiment analysis to the narrative framing itself, allowing you to score the context around the innovation sentiment. This dual approach gives you a more nuanced understanding of the anomaly.
Here are three specific builds you can implement based on this spike:
Real-time Notification System: Set a threshold for momentum spikes, say above +1.200, and use a webhook to send alerts whenever this threshold is crossed. This way, you can respond immediately to new developments in the innovation sector.
Geographic Insights Dashboard: Utilize the geographic filtering capabilities to create a dashboard that visualizes sentiment trends across different regions. For example, you could set up a signal to trigger when sentiment in the US rises significantly compared to Europe.

Geographic detection output for innovation filter. No geo data leads by article count. Bar colour: sentiment direction. Source: Pulsebit articles[].country.
- Narrative Score Comparison: Build a function that continuously runs the meta-sentiment analysis on the most recent innovation narratives and compares the scores over time. Set a threshold to flag any significant increases, indicating shifts in how innovation is being perceived.
To get started, check out the Pulsebit API documentation here: pulsebit.lojenterprise.com/docs. You can copy-paste the provided code and run it in under 10 minutes, enabling you to harness the power of sentiment analysis in real-time.

Top comments (0)