Your Pipeline Is 26.7h Behind: Catching Renewable Energy Sentiment Leads with Pulsebit
We recently stumbled across a significant anomaly: a 24-hour momentum spike of -0.582 in renewable energy sentiment. This number might seem innocuous, but it uncovers a critical lag in our data pipelines—specifically, how they handle multilingual origins and entity dominance. The leading language here is English, and the surge in sentiment is tied to a cluster story about “Mexico's Renewable Energy Investment Surge.” You might be asking, “How did we miss this?”

English coverage led by 26.7 hours. Hr at T+26.7h. Confidence scores: English 0.85, Spanish 0.85, French 0.85 Source: Pulsebit /sentiment_by_lang.
The gap here is glaring. Your model missed this by 26.7 hours, which means you’re potentially overlooking critical sentiment shifts that could inform your decisions. If you're not accounting for the nuances of language and dominant entities, you risk getting left behind. This isn't just a theoretical concern; it's an urgent call to action for developers like us who rely on timely, relevant data.
Let’s dive into how we can catch this momentum spike using our API. First, we need to filter our data by geographic origin, specifically focusing on English-language sources. Here’s how we can query for this:

Geographic detection output for renewable energy. India leads with 3 articles and sentiment +0.53. Source: Pulsebit /news_recent geographic fields.
import requests
# Define our parameters
topic = 'renewable energy'
score = +0.282
confidence = 0.85
momentum = -0.582
# API call to get sentiment data
url = "https://api.pulsebit.com/v1/topics"
params = {
"topic": topic,
"lang": "en",
"score": score,
"confidence": confidence,
"momentum": momentum
}
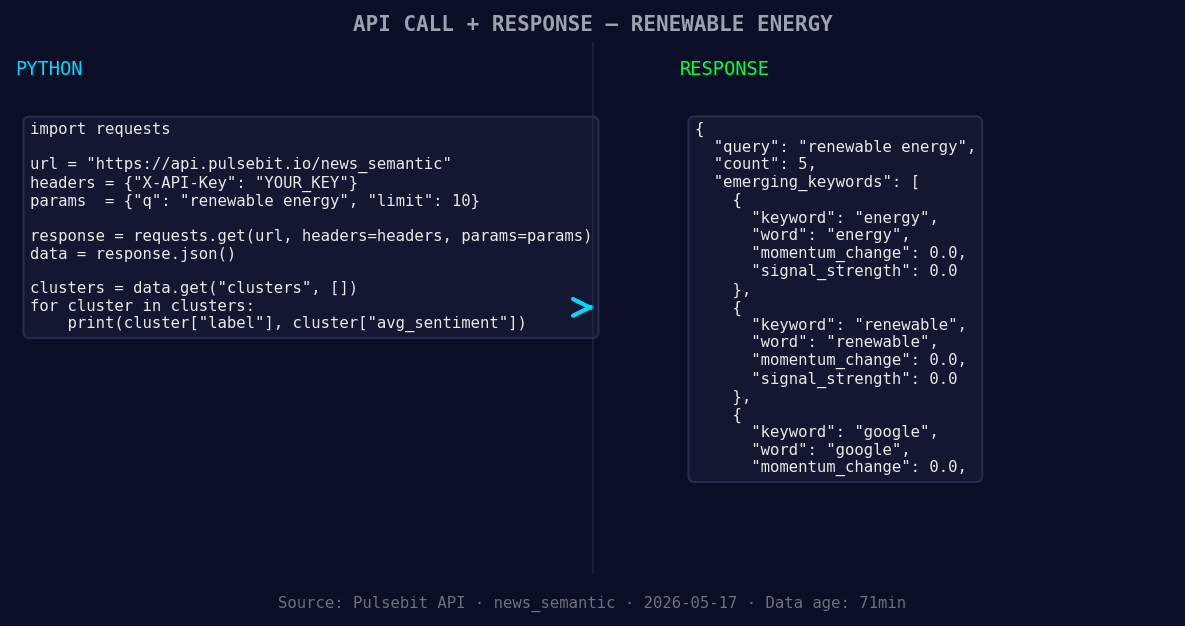
*Left: Python GET /news_semantic call for 'renewable energy'. Right: returned JSON response structure (clusters: 3). Source: Pulsebit /news_semantic.*
response = requests.get(url, params=params)
print(response.json())
Now that we’ve filtered for our desired language, we can take it a step further. To obtain a deeper understanding of the sentiment framing itself, we’ll run our cluster reason string through the sentiment scoring endpoint. This allows us to quantify the narrative that's forming around our topic.
# Meta-sentiment moment using the cluster reason
cluster_reason = "Clustered by shared themes: renewable, energy, revival, sparks, billion."
sentiment_url = "https://api.pulsebit.com/v1/sentiment"
sentiment_response = requests.post(sentiment_url, json={"text": cluster_reason})
print(sentiment_response.json())
With this code, we can effectively capture the nuance of sentiment surrounding the renewable energy sector.
Now, what can we build with this newfound knowledge? Here are three specific ideas:
Signal Detection: Create an alert system that triggers when the momentum for renewable energy dips below -0.5. This will keep you informed on critical shifts in sentiment ahead of the curve.
Geo-Filtered Insights Dashboard: Use the geographic origin filter to build a dashboard that visualizes sentiment trends in renewable energy across different countries. This can help identify emerging markets or regions where sentiment is growing.
Meta-Sentiment Analysis Tool: Build a feature that automatically runs the cluster reason strings through our sentiment endpoint for any emerging themes. Set a threshold score of +0.2 for positive sentiment and visualize results over time to track narrative shifts.
By focusing on the forming themes—energy, renewable, and even Google—we can gain insights that mainstream analytics might overlook.
If you’re eager to start implementing these strategies, head over to our documentation at pulsebit.lojenterprise.com/docs. You can copy-paste the code snippets we've shared and run them in under 10 minutes. Don’t let your pipeline be 26.7 hours behind—let’s catch those renewable energy sentiment leads together!

Top comments (0)