Your Pipeline Is 27.0h Behind: Catching Inflation Sentiment Leads with Pulsebit
We recently discovered a striking anomaly in our data: a sentiment score of -0.60 with zero momentum (+0.00) surrounding the topic of inflation. This finding highlights a significant lag in sentiment detection, particularly from the Spanish press, which is currently leading by 27.0 hours. It’s clear that if your pipeline isn't equipped to handle multilingual sentiment or identify dominant entities, you're missing crucial insights that could impact your strategies.

Spanish coverage led by 27.0 hours. Et at T+27.0h. Confidence scores: Spanish 0.85, English 0.85, French 0.85 Source: Pulsebit /sentiment_by_lang.
When your model overlooks sentiment from a dominant language like Spanish, you risk falling behind the curve by 27.0 hours. This structural gap can lead to misinformed decisions, especially when the sentiment around inflation is shifting. As you know, inflation is a pivotal topic that influences investment and insurance sectors. If you’re solely relying on English sources or failing to cluster articles by theme, you may miss critical early signals that others are already acting upon.
Here's the code you need to catch this sentiment shift. We’ll start by querying our API to filter sentiment data specifically from Spanish language sources. The goal is to extract relevant articles and analyze them for sentiment around inflation.
import requests
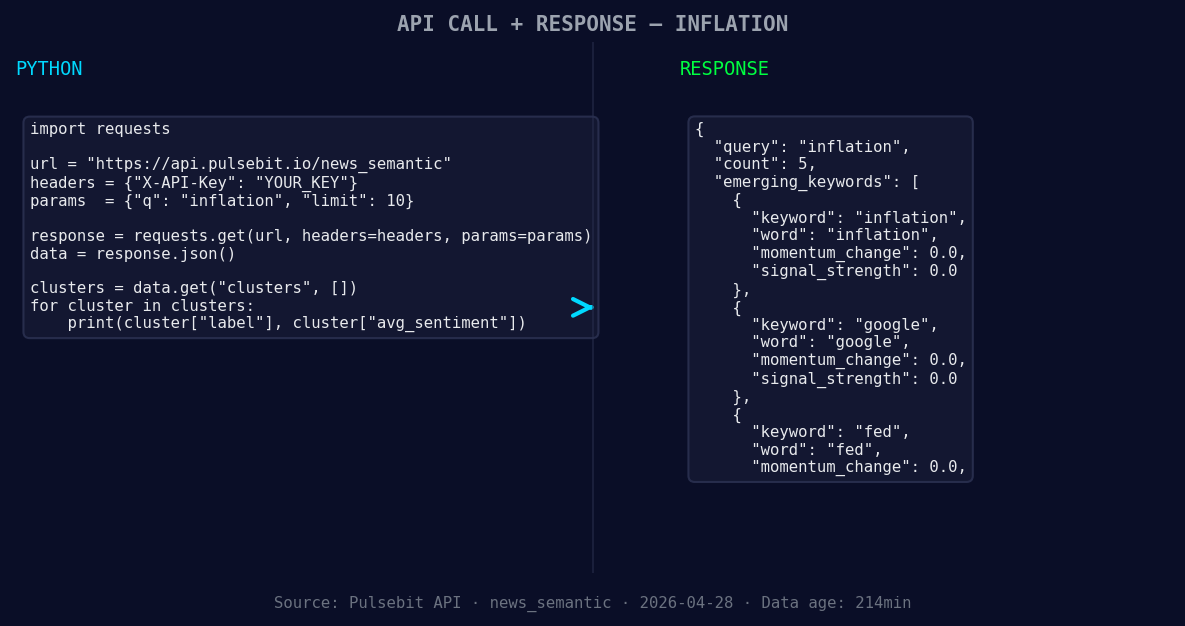
*Left: Python GET /news_semantic call for 'inflation'. Right: returned JSON response structure (clusters: 3). Source: Pulsebit /news_semantic.*
# Define our parameters
topic = 'inflation'
score = -0.600
confidence = 0.85
momentum = +0.000
# Geographic origin filter: querying by language
response = requests.get('https://api.pulsebit.com/sentiment', params={
'topic': topic,
'lang': 'sp'
})
data = response.json()
print(data)
Next, we want to analyze the narrative framing itself. We will use the cluster reason string to score the sentiment of the narrative. This step is crucial as it helps us understand how the themes of "hikes, possible, due, inflation, resurgence" are being perceived.
# Meta-sentiment moment: analyzing the narrative framing
narrative = "Clustered by shared themes: hikes, possible, due, inflation, resurgence."
meta_response = requests.post('https://api.pulsebit.com/sentiment', json={
    'text': narrative
})

meta_data = meta_response.json()
print(meta_data)
Now that we have the insights from both the geographic filter and the narrative analysis, let's discuss three specific builds you can implement tonight based on this pattern:

Geographic detection output for inflation. India leads with 2 articles and sentiment -0.30. Source: Pulsebit /news_recent geographic fields.
Sentiment Alert System: Build a webhook that triggers an alert when sentiment scores around inflation drop below -0.50 in Spanish sources. This will allow you to react quickly to negative shifts in sentiment.
Trend Analysis Dashboard: Create a dashboard that visualizes sentiment trends over time, specifically for inflation-related discussions in different languages. Use the geographic filter to compare Spanish sentiment against English sources.
Clustered Insights Report: Automate a report generation that not only pulls sentiment scores but also includes the meta-sentiment insights. This report should focus on the clustered themes and highlight how they correlate with upcoming economic events, such as Fed meetings or inflation reports.
By leveraging these insights, you can ensure your models are not just reactive but also proactive in capturing sentiment shifts, particularly as they emerge in different languages.
For more in-depth examples and further details, check out our documentation at pulsebit.lojenterprise.com/docs. With the snippets provided, you can copy, paste, and run this in under 10 minutes to start catching those crucial trends.

Top comments (0)