Your Pipeline Is 26.9h Behind: Catching Software Sentiment Leads with Pulsebit
We recently discovered a striking anomaly in our sentiment analysis: a 24h momentum spike of +0.279 in the software sector. This spike isn't just a number; it signals a significant shift in sentiment around software-related themes, particularly following the news that "SLB Acquires S&P Global's Energy Software." As developers, we need to pay attention to these trends, especially when they emerge so rapidly and can indicate underlying shifts in the market.
But here's the catch: your model missed this opportunity by 26.9 hours, as the English press dominated the conversation with a 0.0 hour lag compared to the reference point. If your pipeline doesn't account for multilingual origins or entity dominance, you're likely lagging behind in important conversations that could shape your strategies. Ignoring these nuances means you might miss critical signals that can inform your decision-making.

English coverage led by 26.9 hours. Ro at T+26.9h. Confidence scores: English 0.80, Spanish 0.80, French 0.80 Source: Pulsebit /sentiment_by_lang.
To catch these shifts in sentiment, we can leverage our API to filter for specific topics and analyze sentiment more deeply. Here's how you can do this in Python:
import requests
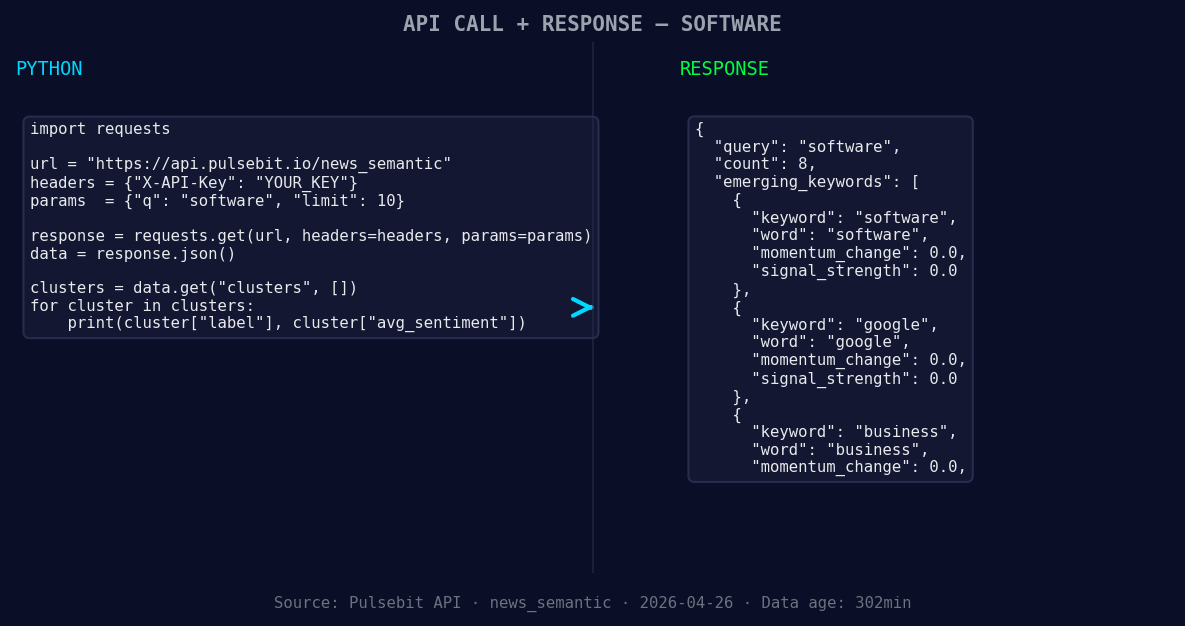
*Left: Python GET /news_semantic call for 'software'. Right: returned JSON response structure (clusters: 3). Source: Pulsebit /news_semantic.*
# Step 1: Geographic origin filter for English language
url = "https://api.pulsebit.lojenterprise.com/sentiment"
params = {
"topic": "software",
"lang": "en"
}
response = requests.get(url, params=params)
data = response.json()
# Step 2: Process the retrieved data
momentum = data['momentum_24h']
signal_strength = data['signal_strength']
sentiment_score = data['sentiment_score']
confidence = data['confidence']
print(f"Momentum: {momentum}, Signal Strength: {signal_strength}, Sentiment Score: {sentiment_score}, Confidence: {confidence}")
# Step 3: Meta-sentiment moment
meta_sentiment_input = "Clustered by shared themes: hoy, festival, latinoamericano, software, libre."
meta_response = requests.post(url, json={"text": meta_sentiment_input})
meta_data = meta_response.json()
print(f"Meta Sentiment Score: {meta_data['sentiment_score']}")
In this code, we first query our API for sentiment around the topic of "software" specifically in English. This geographic filter is crucial because it helps us pinpoint discussions that are more relevant to our target audience. After retrieving the data, we print out the momentum, signal strength, sentiment score, and confidence level.

Geographic detection output for software. India leads with 4 articles and sentiment +0.09. Source: Pulsebit /news_recent geographic fields.
Next, we run a meta-sentiment analysis on the cluster reason string: "Clustered by shared themes: hoy, festival, latinoamericano, software, libre." This allows us to evaluate the narrative framing itself—essential for understanding the context that surrounds our data.
Now, what can we build with this newfound insight? Here are three specific actions you can take:
Immediate Alert System: Set a threshold for sentiment spikes above +0.250 in the software sector. Use the geographic filter to trigger alerts for any English-language articles that meet this criterion.
Meta-Sentiment Dashboard: Build a dashboard that visualizes the clustering of narratives around emerging trends. Use the meta-sentiment loop to dynamically update sentiment scores based on the themes discussed, particularly focusing on software, google, and business, while contrasting them with mainstream themes like hoy, festival, and latinoamericano.
Comparative Analysis Tool: Develop a comparative analysis tool that evaluates sentiment shifts in software against other sectors, such as business or technology, using the same geographic filters. This will help you identify if the software spike is part of a broader trend or a standalone anomaly.
If you’re ready to dive in and start building, check out our documentation: pulsebit.lojenterprise.com/docs. With just a little effort, you can copy-paste the code above and run it in under 10 minutes, opening up a world of insights that keep you ahead of the curve.

Top comments (0)