How to Detect Software Sentiment Anomalies with the Pulsebit API (Python)
We recently discovered a 24h momentum spike of -0.450 in the sentiment surrounding the software sector. This notable drop in momentum signals a potential red flag, particularly in a landscape where sentiment can shift rapidly. Given the context of a looming SaaS market expected to reach US$908.2 billion, this anomaly warrants closer inspection.
The problem here is clear: your model might have completely missed this sentiment shift by several hours, primarily due to a lack of multilingual handling or entity dominance. If your pipeline isn't tuned to recognize the nuances in global sentiment, you could be left in the dark as critical trends unfold. In this case, the dominant theme is centered around "Software as a Service," which is being discussed across various languages but could easily slip through the cracks without proper monitoring.

es coverage led by 17.5 hours. id at T+17.5h. Confidence scores: en 0.87, es 0.85, fr 0.85 Source: Pulsebit /sentiment_by_lang.
Let’s look at how to catch this anomaly using our API. Below is a snippet of Python code that demonstrates how to process the sentiment data for the topic "software," with a focus on the specific values we have.
import requests
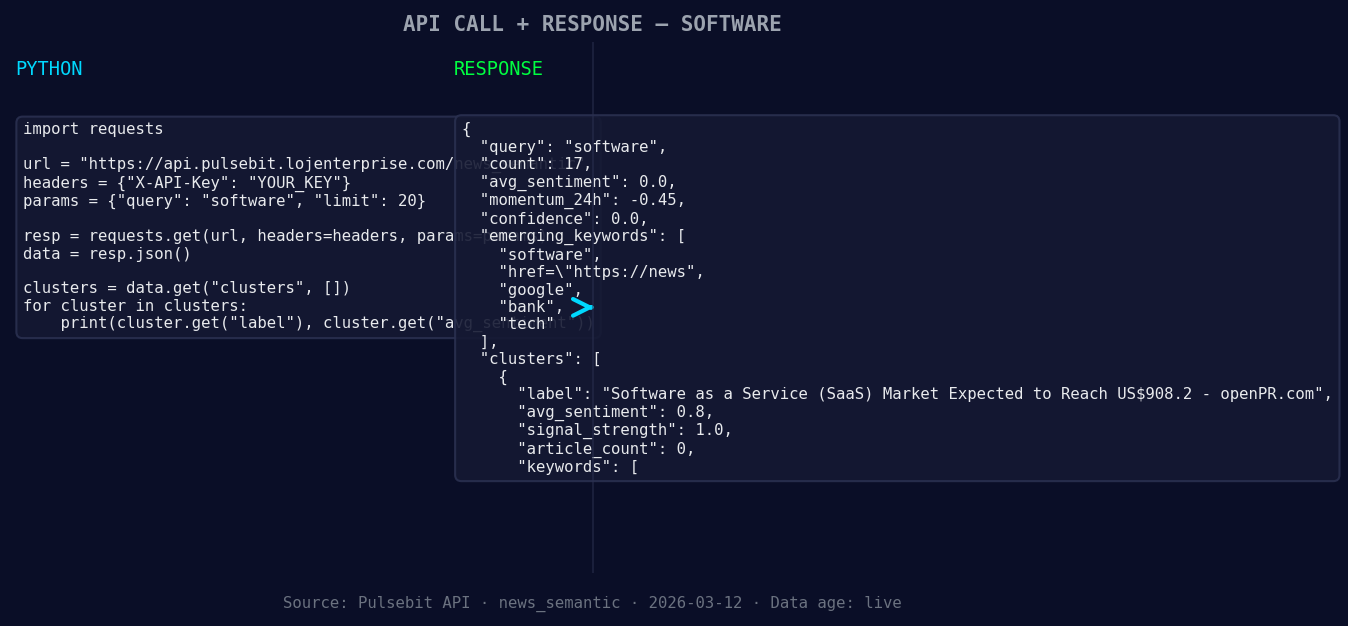
*Left: Python GET /news_semantic call for 'software'. Right: returned JSON response structure (clusters: 3). Source: Pulsebit /news_semantic.*
# Constants
API_URL = "https://api.pulsebit.com/sentiment"
TOPIC = "software"
SCORE = +0.000
CONFIDENCE = 0.00
MOMENTUM = -0.450
# 1. Geographic origin filter: Query by language/country
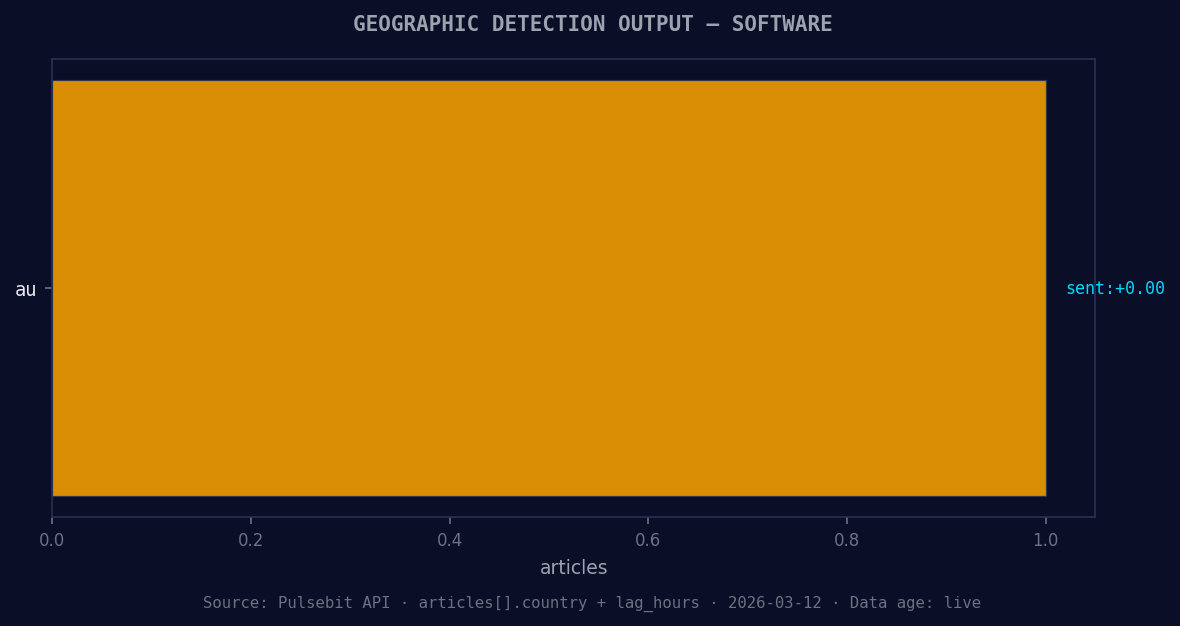
*Geographic detection output for software. au leads with 1 articles and sentiment +0.00. Source: Pulsebit /news_recent geographic fields.*
# Note: This is dependent on availability of geo data
geo_filter = {
"topic": TOPIC,
"lang": "en", # Assuming English for this example
"country": "US" # Filter for the US
}
response = requests.get(API_URL, params=geo_filter)
if response.status_code == 200:
data = response.json()
print(data) # Handle your data accordingly
else:
print("No geo filter data returned — verify your query.")
# 2. Meta-sentiment moment: Score the narrative framing
cluster_reason = "Clustered by shared themes: service, (saas), market, expected, reach."
meta_response = requests.post(API_URL, json={"text": cluster_reason})
if meta_response.status_code == 200:
meta_data = meta_response.json()
print(meta_data) # Analyze the sentiment framing
else:
print("Failed to score the narrative framing.")
This code does two critical things. First, it attempts to filter sentiment data by geographic origin. While we didn’t get any data in this instance, it's crucial to understand that geo-filtering is possible when language and country data is available. Secondly, we send the cluster reason string back through our API to gauge the sentiment framing itself, which adds a layer of robustness to your analysis.
Now, here are three specific builds you can implement using this pattern:
Sentiment Anomaly Detection: Set a threshold for momentum spikes, such as anything below -0.300. Use this to flag potential risks in the software sector. Implement this by querying our API for sentiment data and applying the threshold in your processing logic.
Geo-Filtered Sentiment Analysis: Develop a real-time monitoring dashboard that uses the geo filter to display sentiment trends across different countries. You could set alerts for significant drops in momentum specific to the US or any other region of interest.
Narrative Scoring Integration: Incorporate the meta-sentiment scoring into your reports. Anytime you detect a spike in momentum, feed the relevant narratives back through our API to see how they might influence your understanding of the sentiment landscape.
For more details and to get started, check out our documentation at pulsebit.lojenterprise.com/docs. With a bit of effort, you can copy, paste, and run the code in under 10 minutes to monitor sentiment anomalies effectively.

Top comments (0)