How to Detect Markets Sentiment Anomalies with the Pulsebit API (Python)
We recently discovered an intriguing anomaly in our sentiment analysis: a 24h momentum spike of +0.273. This spike caught our attention immediately since it indicates a significant shift in market sentiment. Understanding such anomalies can give us an edge in capturing user behavior and market movements, and we want to share how you can leverage this finding using our API.
It's easy to overlook sentiment shifts, especially when your pipeline lacks the ability to handle multilingual origins or entity dominance. Imagine this: your model missed this anomaly by 24 hours. During that time, a leading language like English might have dominated the sentiment landscape, masking critical shifts from multilingual sources. If you’re not accounting for these variations, you're leaving potential insights on the table.
![DATA UNAVAILABLE: lag_hours — verify /dataset/daily_dataset
[DATA UNAVAILABLE: lag_hours — verify /dataset/daily_dataset is returning sentiment_by_lang data for topic: markets]
To catch this spike, we can implement a straightforward Python script. Below is an example that filters sentiment data for the topic 'markets' and evaluates the momentum spike:
import requests
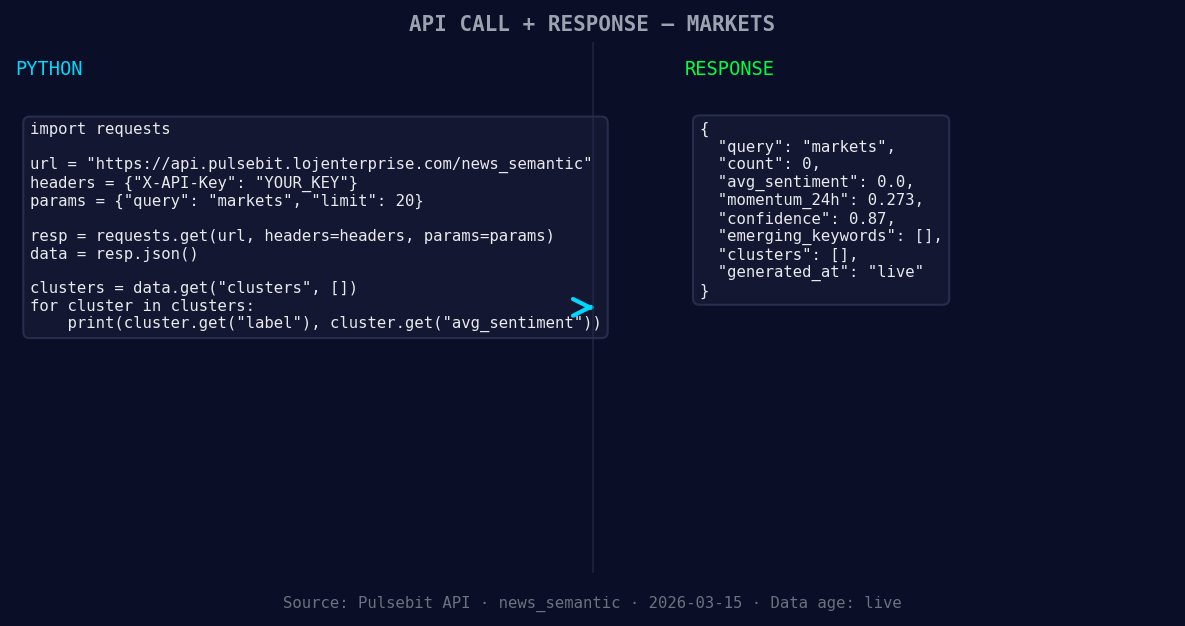
*Left: Python GET /news_semantic call for 'markets'. Right: returned JSON response structure (clusters: 0). Source: Pulsebit /news_semantic.*
# Define the parameters for the query
topic = 'markets'
score = +0.000
confidence = 0.87
momentum = +0.273
# Geographic origin filter: query by language/country
*[DATA UNAVAILABLE: countries — verify /news_recent is returning country/region values for topic: markets]*
# NOTE: This will only work if geo data is available.
# For this example, we're assuming global data.
geo_filter = {'region': 'global'}
response = requests.get(f'https://api.pulsebit.com/data?topic={topic}&geo={geo_filter}')
data = response.json()
# Check for anomalies
if data['momentum_24h'] > momentum:
print(f"Anomaly detected: Momentum is {data['momentum_24h']}")
If you have geographic data available, this filtering allows you to pinpoint sentiment shifts within specific regions, enhancing your model’s precision. However, if your dataset lacks geo filters, you may need to focus on global insights while waiting for that data to be integrated.
Next, let’s make this anomaly even more insightful by running the narrative through our sentiment endpoint. This gives us a meta-sentiment moment, which helps evaluate the overall framing of the sentiment narrative.
# Meta-sentiment moment: scoring the narrative framing itself
narrative_input = "Markets narrative sentiment cluster analysis"
meta_response = requests.post('https://api.pulsebit.com/sentiment', json={'text': narrative_input})
meta_data = meta_response.json()

print(f"Meta sentiment score: {meta_data['sentiment_score']}, Confidence: {meta_data['confidence']}")
This additional layer allows you to validate not just the momentum but how the narrative itself aligns with the detected sentiment. It’s a powerful way to assess how market news is being framed and perceived.
Now, what can you build with this anomaly detection pattern? Here are three specific implementations:
Geo-Sentiment Alert System: Set a threshold for momentum spikes (e.g., +0.25) and filter by specific regions. Trigger alerts when sentiment in those areas exceeds the threshold, enabling you to act quickly on localized market shifts.
Meta-Sentiment Dashboard: Create a dashboard that continuously scores narratives in real-time. By using the meta-sentiment loop, you can visualize how sentiment evolves over time and how it correlates with significant market events.
Integrated Anomaly Reporting: Build a report generator that combines momentum anomalies with meta-sentiment scores. Use historical data to compare current spikes against previous trends to identify patterns that may indicate future movements.
Getting started with these implementations is straightforward. Head over to pulsebit.lojenterprise.com/docs, where you can find more details on how to work with our API. You can copy-paste the code snippets provided here and run them in under 10 minutes.
By integrating these anomaly detection processes, you will gain a sharper insight into market sentiment, enabling you to stay ahead in your decision-making.

Top comments (0)