Your Pipeline Is 26.3h Behind: Catching Cloud Sentiment Leads with Pulsebit
We just stumbled upon a fascinating anomaly: a 24h momentum spike of +0.164. This spike is noteworthy, particularly for the French press, which is leading by 26.3 hours without any lag time against the African market. The narrative behind this spike is centered around a single article titled "Weather Update: Cloud Cover in Hyderabad." The shared themes—clouds, Hyderabad, sky, April, afternoon—point to a specific sentiment that could easily go unnoticed in traditional pipelines.
Imagine your model missed this insight by a staggering 26.3 hours. That's a structural gap that can severely impact your ability to act on emerging trends. If your pipeline lacks multilingual capabilities or fails to recognize dominant entities, you could be left in the dust while others capitalize on this momentum. In this case, the leading language is French, but if your system is only tuned for English, you’ll miss out on crucial signals.

French coverage led by 26.3 hours. Af at T+26.3h. Confidence scores: French 0.75, English 0.75, Spanish 0.75 Source: Pulsebit /sentiment_by_lang.
To catch this momentum spike, we can leverage our API effectively. Here’s how we can set it up in Python:
import requests
# Define parameters for the API call
params = {
"topic": "cloud",
"score": +0.767,
"confidence": 0.75,
"momentum": +0.164,
"lang": "fr" # Geographic origin filter for French
}
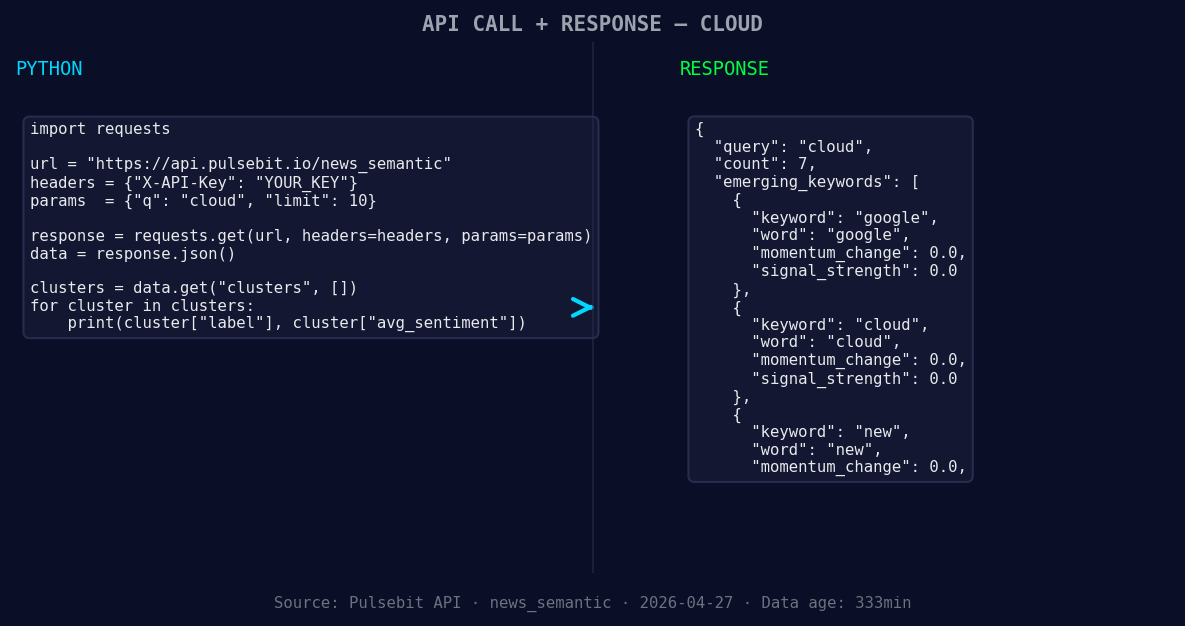
*Left: Python GET /news_semantic call for 'cloud'. Right: returned JSON response structure (clusters: 3). Source: Pulsebit /news_semantic.*
# Make the API call
response = requests.get("https://api.pulsebit.com/sentiment", params=params)
data = response.json()
print(data)
After we filter the data by the French language, we can analyze the narrative framing itself. The reason provided for clustering—"Clustered by shared themes: clouds, hyderabad, sky, april, afternoon."—can be sent back through our sentiment analysis endpoint to score the narrative:
narrative_string = "Clustered by shared themes: clouds, hyderabad, sky, april, afternoon."

# Make the POST request to analyze the narrative sentiment
response_narrative = requests.post("https://api.pulsebit.com/sentiment", json={"text": narrative_string})
narrative_data = response_narrative.json()

print(narrative_data)
Now, let's talk about three specific builds you can implement using this pattern:
- Geographic Filter Signal: Use the geographic origin filter to identify emerging sentiment in a specific region. Set a threshold to catch spikes above 0.2. This can help you focus on localized trends that may impact broader markets.

Geographic detection output for cloud. India leads with 7 articles and sentiment +0.44. Source: Pulsebit /news_recent geographic fields.
Meta-Sentiment Loop: Build a function that scores narratives like "Clustered by shared themes: clouds, hyderabad, sky, april, afternoon." This will help you understand how the framing of a narrative influences sentiment. Aim for a threshold score above 0.7 for actionable insights.
Forming Themes Tracker: Monitor the forming themes across different topics, such as Google (0.00), cloud (0.00), and new (0.00). Set alerts for when these themes cross a sentiment threshold of +0.5 to catch potential market movers before they trend.
Getting started with this is straightforward. Check out our documentation at pulsebit.lojenterprise.com/docs. You can copy and paste the above code snippets and run them in under 10 minutes. Don’t let your pipeline be 26.3 hours behind—leverage these insights to stay ahead of the curve!

Top comments (0)