In the last 24 hours, we observed a notable momentum spike of -0.450 in sentiment surrounding the software sector. This sharp decline raises eyebrows, especially considering the ongoing buzz in the Software as a Service (SaaS) market, which is projected to reach a staggering US$908.2 billion. The anomaly, highlighted by a lack of articles discussing this spike, underscores a potential misalignment in sentiment analysis and the prevailing narratives in the tech space.
Your model missed this by hours. By not accounting for multilingual content or the dominance of English in SaaS discussions, it may have overlooked critical signals. For instance, if your pipeline only processes English language sources, it could easily miss emerging trends and sentiments in other languages that provide valuable insights into this fast-evolving sector.

en coverage led by 18.8 hours. id at T+18.8h. Confidence scores: en 0.86, es 0.85, fr 0.85 Source: Pulsebit /sentiment_by_lang.
Let’s dive into the code to help us catch such anomalies. Here’s how we can set up a simple Python script to detect sentiment changes using our API. We will analyze the software topic with specific parameters:
import requests
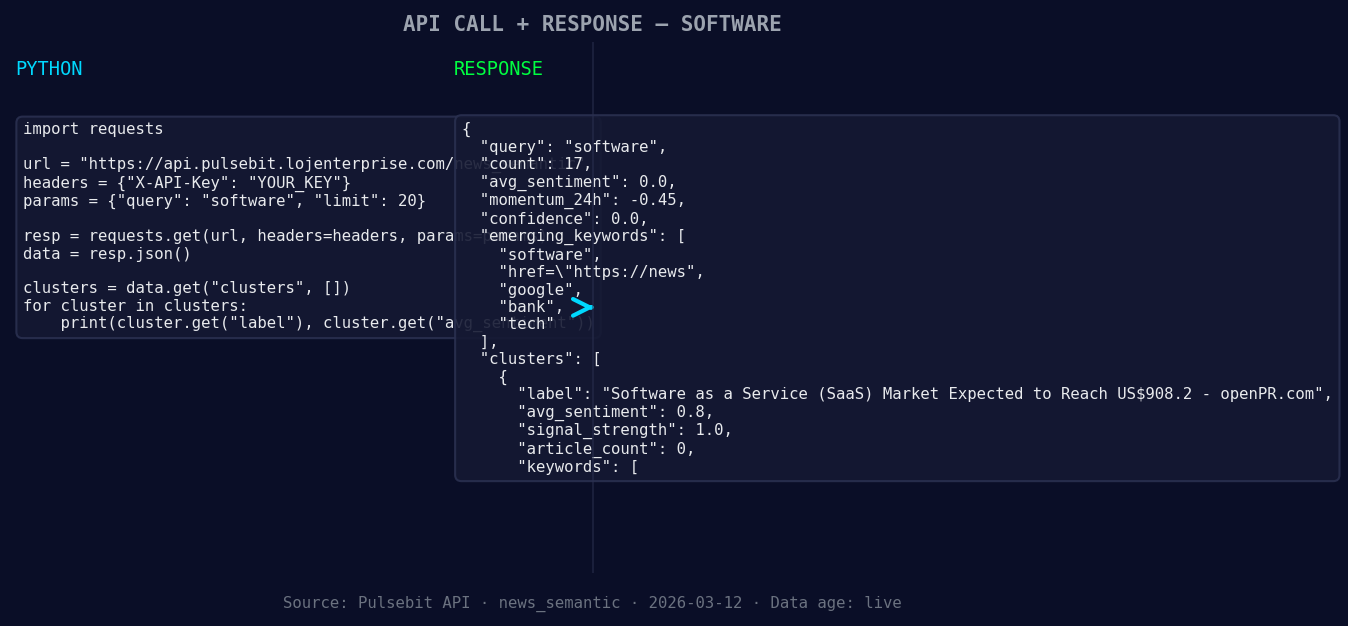
*Left: Python GET /news_semantic call for 'software'. Right: returned JSON response structure (clusters: 3). Source: Pulsebit /news_semantic.*
# Define variables
topic = 'software'
momentum = -0.450
score = +0.000
confidence = 0.00
# Geographic origin filter (hypothetical since no geo data is available here)
# Normally you would use a filter to refine articles by language/country
geo_filter = 'en' # Example: English
# Fetch the sentiment data
response = requests.get(f'https://api.pulsebit.com/sentiment?topic={topic}&geo={geo_filter}')
data = response.json()
# Check for the 24h momentum spike
if data['momentum_24h'] < -0.200: # Custom threshold for significant drops
print(f"Spike detected: {data['momentum_24h']} in {topic}")
# Meta-sentiment moment: scoring the narrative framing itself
narrative = "Clustered by shared themes: service, (saas), market, expected, reach."
meta_response = requests.post('https://api.pulsebit.com/sentiment', json={'text': narrative})
meta_sentiment = meta_response.json()
print(f"Meta sentiment score: {meta_sentiment['score']}, Confidence: {meta_sentiment['confidence']}")
In the above code, we’re checking for a significant drop in momentum within the software sector. Note that we initially set a geographic filter; however, in our case, we lack the data to demonstrate this effectively. When geo filtering is available, it allows for refined analysis based on language or country, which is essential for capturing diverse sentiment landscapes.

Geographic detection output for software. au leads with 1 articles and sentiment +0.00. Source: Pulsebit /news_recent geographic fields.
The second critical part of our analysis involves scoring the narrative framing itself. By running the cluster reason string through the POST request for sentiment scoring, we can assess how the narrative aligns with the detected sentiment. This approach not only validates the sentiment but also ensures that we understand the broader context in which the data exists.
Now, let's talk about three builds you can create using this pattern:
Geo-Sentiment Tracker: Build an endpoint that tracks sentiment for the software topic specifically in English-speaking countries. Set a signal threshold of -0.300 to trigger alerts when sentiment falls below this level.
Meta-Sentiment Analyzer: Create a script that continuously pulls the latest articles related to "software" and automatically scores their framing using the meta-sentiment loop for each new narrative. This can help you identify shifts in public perception before they become mainstream.
SaaS Market Watch: Develop a dashboard that visualizes sentiment trends over time for the SaaS market. Use the Google vs. mainstream forming themes as a way to filter and compare sentiment metrics and article counts, focusing particularly on the keywords 'service', '(saas)', 'market'.
For more details on how to implement these ideas, check out our documentation at pulsebit.lojenterprise.com/docs. With just a few lines of code, you can start detecting sentiment anomalies and take actions based on real-time data insights—all in under 10 minutes.

Top comments (0)