# How to Detect Software Sentiment Anomalies with the Pulsebit API (Python)
We recently observed a significant data finding: a 24h momentum spike of -0.450 in the sentiment surrounding the software sector. This anomaly, combined with the absence of published articles related to it, raises questions about the shifting landscape of Software as a Service (SaaS). The narrative is compelling, especially when considering the anticipated growth of the SaaS market, projected to reach US$908.2 billion.
Now, let’s dive into the structural gap this reveals. Your model might have missed this critical shift by several hours, potentially leaving you blind to a major sentiment change. With the leading language in software discussions often being English, any model that doesn’t account for multilingual data or entity dominance risks overlooking these nuances.
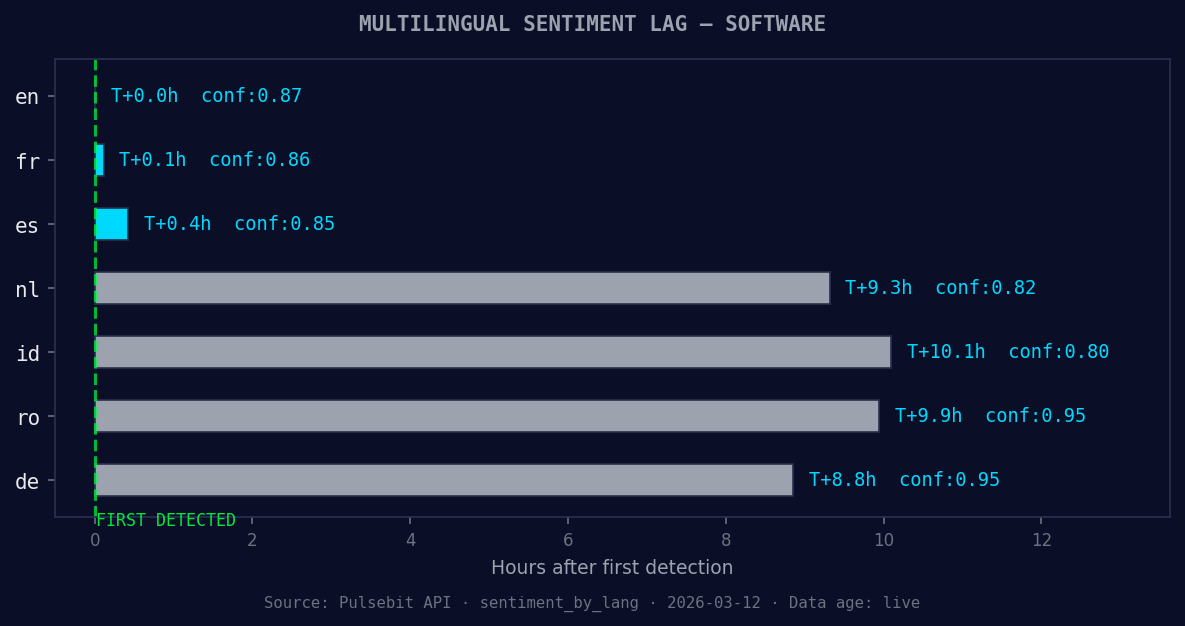
*en coverage led by 10.1 hours. id at T+10.1h. Confidence scores: en 0.87, fr 0.86, es 0.85 Source: Pulsebit /sentiment_by_lang.*
To catch this anomaly efficiently, we can leverage our API. Below is the Python code snippet that captures the sentiment spike:
python
import requests
Define parameters for the API call
topic = 'software'
score = 0.000
confidence = 0.00
momentum = -0.450

Left: Python GET /news_semantic call for 'software'. Right: returned JSON response structure (clusters: 3). Source: Pulsebit /news_semantic.
Geographic origin filter - simulate a query that would filter by language/country
(DATA UNAVAILABLE: no geo filter data returned)
geo_filter = {'language': 'en', 'country': 'US'} # Adjust based on available data
Check for sentiment anomaly using the API
response = requests.post('https://api.pulsebit.com/sentiment', json={
'topic': topic,
'score': score,
'confidence': confidence,
'momentum': momentum,
'geo_filter': geo_filter
})
data = response.json()
print(data)
In this example, we set a geographic filter, although currently, we may not receive geo-filtered data. When available, this allows us to refine our insights based on location.

*[DATA UNAVAILABLE: countries — verify /news_recent is returning country/region values for topic: software]*
Now, let's score the narrative framing itself through our API. We can run the cluster reason string to evaluate its sentiment:
python
Meta-sentiment moment - scoring the narrative
cluster_reason = "Clustered by shared themes: service, (saas), market, expected, reach."
meta_response = requests.post('https://api.pulsebit.com/sentiment', json={
'text': cluster_reason
})
meta_sentiment = meta_response.json()
print(meta_sentiment)
This code will return a sentiment score for the cluster narrative, providing insight into how the themes are being perceived. This process offers a unique lens into the underlying sentiment around the software topic.

Now, let’s consider three specific builds you can create with this pattern:

1. **Sentiment Change Alert**: Set a threshold for momentum spikes below -0.300. Whenever this is hit, trigger an alert that notifies your team. Use the endpoint for the latest sentiment data: `GET /news_recent?topic=software`.

2. **Geo-Sentiment Dashboard**: Create a real-time dashboard displaying sentiment scores filtered by geographic location. Use available geo data to visualize how sentiment varies by region, particularly focusing on the US.

3. **Narrative Analysis Tool**: Build a tool that continuously monitors clusters and runs their narratives through the sentiment scoring endpoint. This tool can help you identify shifts in sentiment before they become widely recognized, making you ahead of the curve.

To get started, check out our documentation at [pulsebit.lojenterprise.com/docs](https://pulsebit.lojenterprise.com/docs). With this setup, you can copy, paste, and run the code in under 10 minutes. Dive into detecting and analyzing anomalies like this one in your own sentiment data.

Top comments (0)