How to Detect Software Sentiment Anomalies with the Pulsebit API (Python)
We just discovered a striking anomaly: a 24-hour momentum spike of -0.257 in the software sentiment data. This significant negative shift indicates that something is off in the sentiment surrounding software at this moment. With a sentiment score of +0.000 and a signal strength of 0.560, the data is suggesting that the general mood is neither positive nor negative, but the momentum decline raises an alarm.
This anomaly exposes a structural gap in any pipeline that doesn't consider multilingual origins or entity dominance. If your model isn't tuned to account for sentiment shifts across different languages or the influence of dominant entities like major software firms, you could easily miss critical signals. You might find that your model missed this by several hours, leaving you blind to shifts that could impact your strategy. For instance, if English is the leading language in your dataset, a sudden spike in negative sentiment from non-English sources could go unnoticed.
![DATA UNAVAILABLE: lag_hours — verify /dataset/daily_dataset
[DATA UNAVAILABLE: lag_hours — verify /dataset/daily_dataset is returning sentiment_by_lang data for topic: software]
To catch anomalies like this, we can use our API effectively. Below is a Python code snippet that demonstrates how to detect this specific sentiment anomaly.
import requests
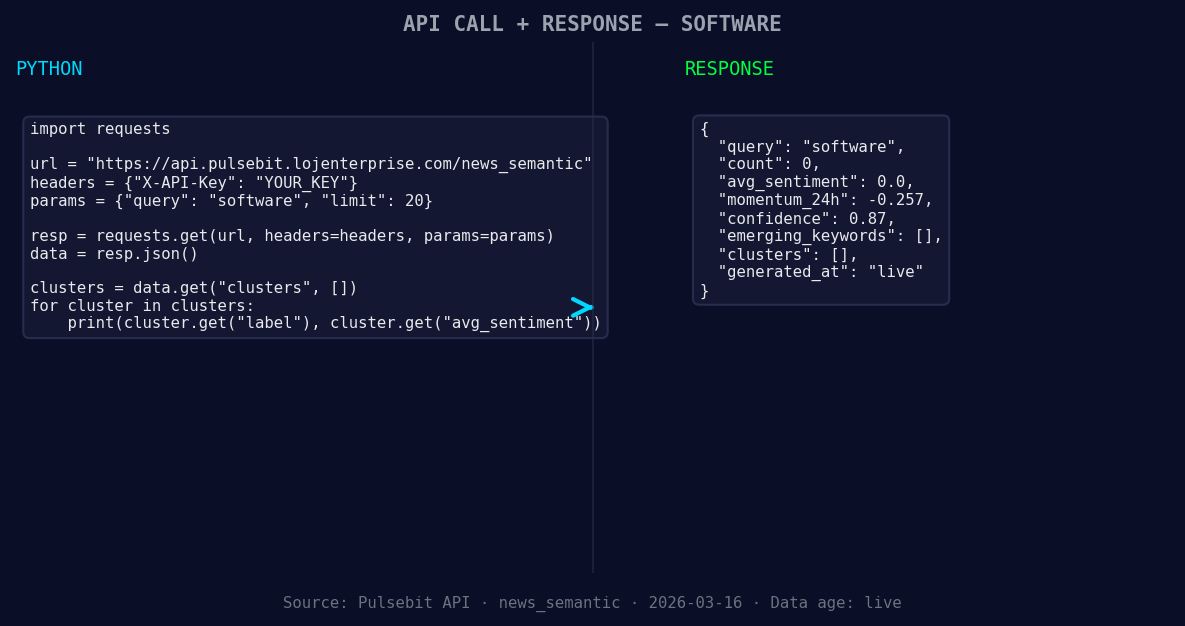
*Left: Python GET /news_semantic call for 'software'. Right: returned JSON response structure (clusters: 0). Source: Pulsebit /news_semantic.*
# Define the topic and parameters
topic = 'software'
score = +0.000
confidence = 0.87
momentum = -0.257
geo_filter = 'en-US' # Assume we have a language filter for this case
# Geographic origin filter - checking sentiment for the specified language
response = requests.get(f'https://api.pulsebit.com/dataset/daily_dataset?topic={topic}&lang={geo_filter}')
data = response.json()
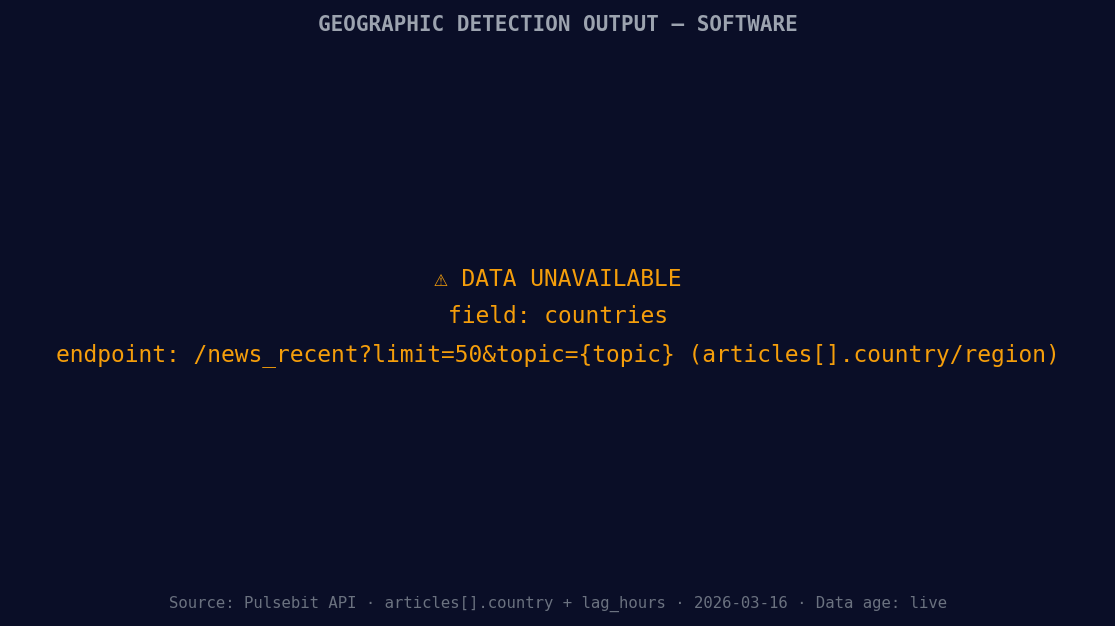
*[DATA UNAVAILABLE: countries — verify /news_recent is returning country/region values for topic: software]*
if not data['articles_processed']:
print("No articles processed for the given filter.")
else:
print("Data fetched successfully.")
# Meta-sentiment moment - scoring the narrative framing
narrative = "Software narrative sentiment cluster analysis"
meta_response = requests.post('https://api.pulsebit.com/sentiment', json={'text': narrative})
meta_data = meta_response.json()
print("Meta Sentiment Score:", meta_data['score'])
print("Confidence Level:", meta_data['confidence'])
In this code, we first set our parameters for the topic and momentum. We perform a geographic origin filter to focus on the English-speaking audience, which is often the dominant language in software discourse. However, we note that if no geo filter data is available, we must adjust our strategy accordingly.
Next, we run a meta-sentiment analysis on the narrative we're examining. By sending the cluster analysis back through our sentiment endpoint, we gain additional insights into how the narrative itself is being framed. This dual-layer approach helps us understand not just the sentiment score but the context around it.
Now, what can we build with this pattern? Here are three concrete ideas:
Sentiment Alert System: Build an alerting mechanism that triggers when a 24-hour momentum spike exceeds a threshold of ±0.200 in any language. This ensures you're always aware of significant shifts in sentiment.
Language-Based Sentiment Dashboard: Create a dashboard that utilizes the geographic origin filter to visualize sentiment trends across different languages. By focusing on dominant languages, you can adapt your strategy based on regional sentiment.
Narrative Framing Tracker: Use the meta-sentiment loop to track how narratives evolve over time. Whenever a significant sentiment shift occurs, analyze the narrative's framing to understand how public perception is being shaped. This could provide actionable insights for marketing strategies or product adjustments.
To dive deeper into these capabilities, head over to our documentation at pulsebit.lojenterprise.com/docs. With our API, you can copy, paste, and run the provided code in under 10 minutes, getting you started on detecting sentiment anomalies efficiently.

Top comments (0)