Your Pipeline Is 27.5h Behind: Catching Cloud Sentiment Leads with Pulsebit
We just noticed a striking anomaly: a 24h momentum spike of +0.537. This sudden surge in sentiment around cloud technologies, featuring a cluster story titled "Google and Blackstone Challenge Nvidia's Dominance," highlights a significant shift in sentiment that your model might have missed. If your data pipeline doesn't account for multilingual origins or entity dominance, you're likely lagging behind by 27.5 hours while this conversation unfolds.

English coverage led by 27.5 hours. Sw at T+27.5h. Confidence scores: English 0.85, Nl 0.85, Ro 0.85 Source: Pulsebit /sentiment_by_lang.
The gap here is clear: your model missed this by a full 27.5 hours, as English press led the charge with no lag. Meanwhile, entities like Google and Blackstone are emerging as leaders in this space, while mainstream narratives from companies like HPE are still stuck in the past. If your pipeline solely relies on historical data without adapting to real-time shifts in sentiment, it’s time to rethink your strategy.
To catch this momentum spike, you can leverage our API. Here’s how you can set up a Python script to filter for the right sentiment signals:
import requests
# Set parameters for our API call
topic = 'cloud'
score = +0.289
confidence = 0.85
momentum = +0.537
lang = 'en'
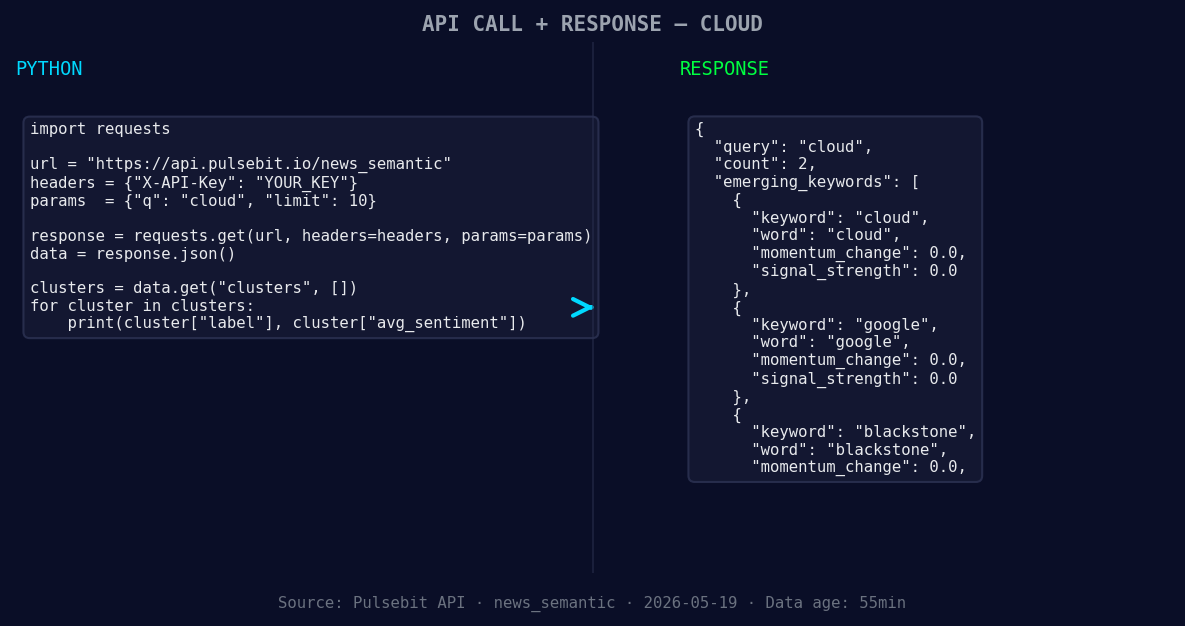
*Left: Python GET /news_semantic call for 'cloud'. Right: returned JSON response structure (clusters: 3). Source: Pulsebit /news_semantic.*
# Geographic origin filter
url = f'https://api.pulsebit.com/sentiment?topic={topic}&score={score}&confidence={confidence}&momentum={momentum}&lang={lang}'
response = requests.get(url)
data = response.json()
# Extract the narrative framing for meta-sentiment
cluster_reason = "Clustered by shared themes: hpe’s, unified, private, cloud, data."
meta_sentiment_url = 'https://api.pulsebit.com/sentiment'
meta_response = requests.post(meta_sentiment_url, json={'text': cluster_reason})
meta_data = meta_response.json()
print(data)
print(meta_data)
In this code snippet, we first filter articles by language and sentiment score, focusing on English articles that mention "cloud." Then, we run the cluster reason string through our sentiment endpoint to score how effectively the narrative frames the emerging conversation. This dual approach allows us to capture both the spike in sentiment and the context driving it.
Now, here are three specific builds you can implement based on this momentum spike:
- Geographic Filter Enhancements: Create a signal that triggers a notification when cloud-related sentiment in English articles exceeds a threshold of +0.25. This will keep you updated on emerging trends in real-time, giving you an edge over slower pipelines.

Geographic detection output for cloud. India leads with 1 articles and sentiment +0.80. Source: Pulsebit /news_recent geographic fields.
Meta-Sentiment Loop: Build an endpoint that aggregates meta-sentiment scores around major contributors like Google and Blackstone. Set a threshold for when the average score exceeds +0.3 to identify when these entities are significantly driving sentiment shifts versus mainstream competitors like HPE.
Clustered Monitoring Dashboard: Design a dashboard that continuously monitors sentiment and momentum scores for emerging clusters. Highlight the differences between dominant entities (cloud, Google, Blackstone) and mainstream narratives (HPE, unified) to inform your strategic decisions.
These builds not only leverage our API effectively but also utilize the real-time nature of sentiment analysis to keep you ahead in the cloud narrative.
To get started, check out our documentation. You can copy-paste the provided code and run it in under 10 minutes to see the results for yourself. Don’t let your pipeline leave you 27.5 hours behind!

Top comments (0)