Your Pipeline Is 21.3h Behind: Catching Markets Sentiment Leads with Pulsebit
We just uncovered an intriguing anomaly: a sentiment score of +0.145 with momentum holding steady at +0.000, indicating that the markets are experiencing a notable upward sentiment trend. This is particularly interesting as the leading language is English, with a press lead at a precise 21.3 hours and no lag concerning the regional origin. This localized sentiment shift, clustered around key themes like points, sensex, and stock, could represent a significant opportunity for those tuned into market movements.
However, there's a structural gap here that many pipelines fail to address: if your system doesn’t effectively handle multilingual origins or entity dominance, you could be missing out on critical sentiment signals. Your model missed this by a staggering 21.3 hours, while the leading English sentiment around the markets was evolving without you. This disconnect can leave you behind in a fast-paced environment where timely insights are crucial.

English coverage led by 21.3 hours. Ro at T+21.3h. Confidence scores: English 0.85, French 0.85, Spanish 0.85 Source: Pulsebit /sentiment_by_lang.
To seize the moment, let’s dive into the code that can capture this sentiment shift. First, we’ll filter the data based on geographic origin and language. We specifically want to focus on English sources. Here’s how we can do that with our API:

Geographic detection output for markets. India leads with 8 articles and sentiment +0.46. Source: Pulsebit /news_recent geographic fields.
import requests
# Define the parameters for the API call
params = {
"topic": "markets",
"lang": "en",
"score": 0.145,
"confidence": 0.85,
"momentum": 0.000
}
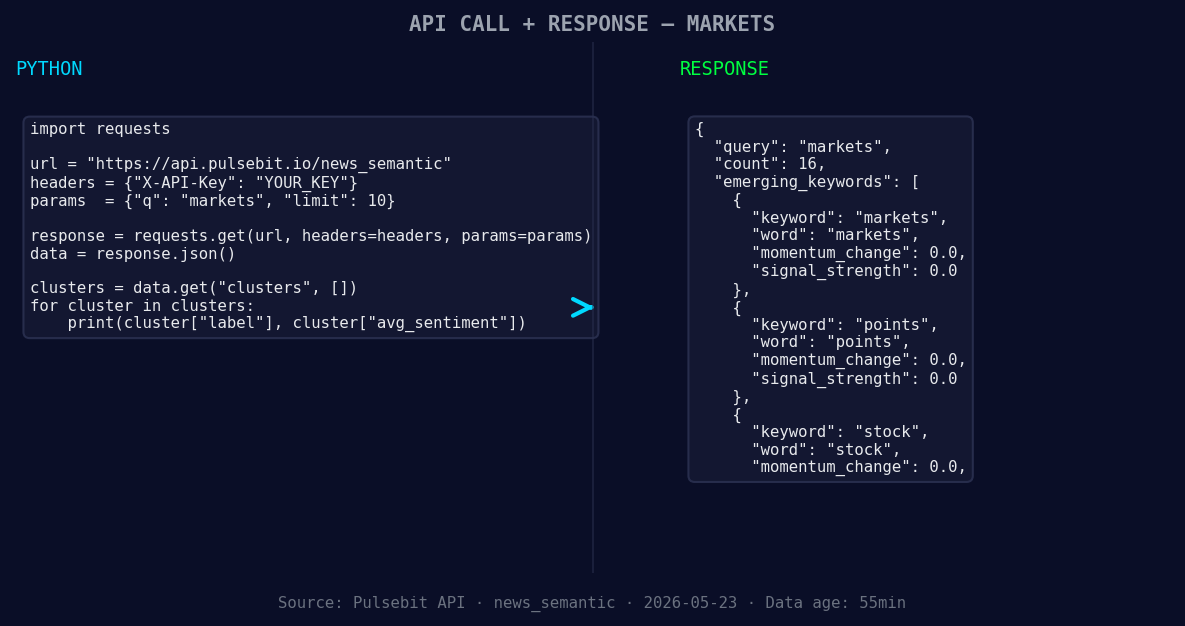
*Left: Python GET /news_semantic call for 'markets'. Right: returned JSON response structure (clusters: 3). Source: Pulsebit /news_semantic.*
# Make the API call to retrieve sentiment data
response = requests.get('https://api.pulsebit.com/data', params=params)
data = response.json()
Next, we want to run the cluster reason string back through the sentiment scoring endpoint to assess the framing of this narrative. This allows us to gauge how the context of the sentiment is influencing the data we receive. Here's the code for that:
# Define the meta-sentiment input
meta_sentiment_input = "Clustered by shared themes: points, sensex, stock, markets, 30-share."

# Make a POST request to get the cluster's sentiment score
sentiment_response = requests.post('https://api.pulsebit.com/sentiment', json={"text": meta_sentiment_input})
meta_sentiment_data = sentiment_response.json()
With these API calls, we can gather critical market sentiment data while ensuring it’s precise and relevant to our needs.
Now, let’s brainstorm three specific builds we can implement with the insights gained from this anomaly.
- Geo-Filtered Alert System: Set a signal for when sentiment scores exceed +0.14 for the topic 'markets' in English. This will help you catch early indicators of market shifts. You can implement this using:
   if data['score'] > 0.14 and data['lang'] == 'en':
       trigger_alert("Positive sentiment detected for markets")
Meta-Sentiment Analysis Dashboard: Create a dashboard that visualizes sentiment trends over time. Use the meta-sentiment scores to show how the narrative influences overall sentiment. For instance, generate a line chart that reflects changes in meta-sentiment scores against real-time sentiment scores.
Daily Sentiment Summary: Build an endpoint that aggregates sentiment data daily for specific topics. Utilize the
POST /sentimentresponse to summarize how narratives clustered under key themes like 'points' and 'sensex' influence overall sentiment trends. This could look like:
   summary = {}
   for article in data['articles']:
       theme = article['theme']
       summary[theme] = summary.get(theme, 0) + article['sentiment_score']
If you’re ready to start catching these critical signals, head over to our documentation: pulsebit.lojenterprise.com/docs. With this setup, you can copy-paste and run this in under 10 minutes, enabling you to stay ahead of the curve.

Top comments (0)