Your Pipeline Is 27.2h Behind: Catching Energy Sentiment Leads with Pulsebit
We recently stumbled upon a striking anomaly: a 24-hour momentum spike of -1.433 in energy sentiment. This spike is not just a number; it reveals a significant gap in how sentiment data is processed, especially when considering the leading language in the news cycle. In this case, the Spanish press is leading the charge by 27.2 hours, leaving your pipeline trailing behind.
The gap here is critical. If your model isn't equipped to handle multilingual origin or entity dominance, you're missing key insights by more than a day. While the Spanish press is highlighting the urgent need for more infrastructure to move energy, your system might still be clinging to outdated data. This can lead to missed opportunities in trading or strategic decision-making, as you find yourself 27.2 hours late to the narrative.

Spanish coverage led by 27.2 hours. Nl at T+27.2h. Confidence scores: Spanish 0.75, English 0.75, French 0.75 Source: Pulsebit /sentiment_by_lang.
To catch this anomaly, let’s dive into the code. We’ll capture sentiment data specifically from the Spanish press, focusing on the topic of energy, and then analyze the narrative framing around it. Here’s how you can do it with our API:
import requests
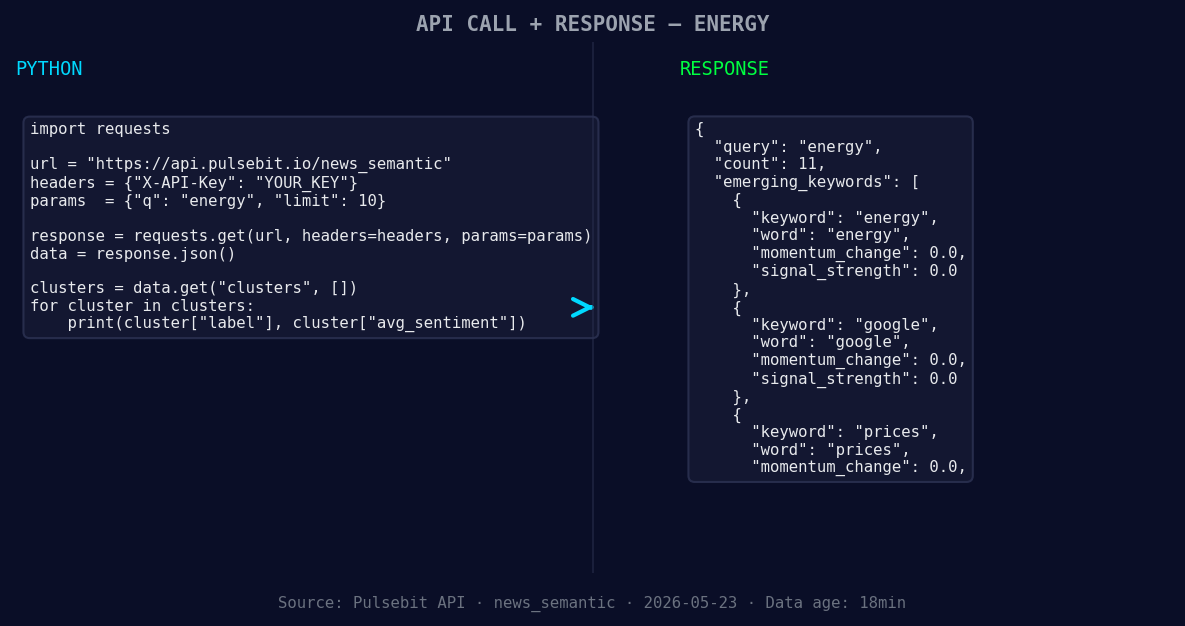
*Left: Python GET /news_semantic call for 'energy'. Right: returned JSON response structure (clusters: 3). Source: Pulsebit /news_semantic.*
# Step 1: Geographic origin filter
url = "https://api.pulsebit.io/sentiment"
params = {
"topic": "energy",
"lang": "sp", # Filter for Spanish language
}
response = requests.get(url, params=params)
data = response.json()
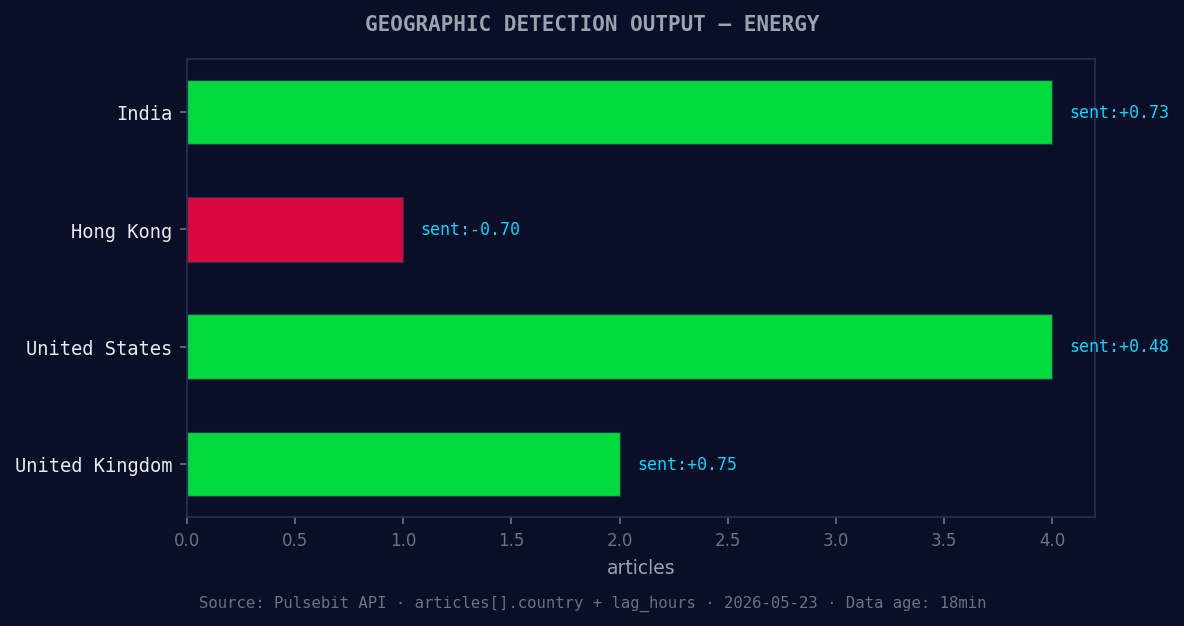
*Geographic detection output for energy. India leads with 4 articles and sentiment +0.73. Source: Pulsebit /news_recent geographic fields.*
print(data) # Inspect the response for insights
# Step 2: Meta-sentiment moment
cluster_reason = "Clustered by shared themes: infrastructure, move, energy, needed, today's."
sentiment_url = "https://api.pulsebit.io/sentiment"
sentiment_response = requests.post(sentiment_url, json={"text": cluster_reason})
meta_sentiment = sentiment_response.json()
print(meta_sentiment) # Review the meta-sentiment analysis
In this snippet, we first filter the sentiment data by Spanish language to ensure we’re catching the latest insights. Then, we score the narrative framing itself by sending the reason string back through our sentiment analysis endpoint. This dual approach allows you to pinpoint not only the raw sentiment but also the contextual framing of the conversation around energy.
Now, what can you build using this data? Here are three actionable steps:
Real-Time Alert System: Set up a signal that triggers when momentum for the energy topic hits a threshold of -1.0. This can be integrated with your existing alerting system to notify you whenever sentiment shifts dramatically.
Multilingual Sentiment Dashboard: Build a dashboard that visualizes sentiment trends across different languages. Use the geo filter to compare sentiment from Spanish outlets against English ones, helping you track how narratives differ across regions.
Meta-Sentiment Analysis Report: Create a report that extracts and analyzes meta-sentiment from clustered themes like "infrastructure" and "energy." This report could run daily, allowing you to understand the framing of discussions around energy in real-time.
If you want to get started, check out our documentation at pulsebit.lojenterprise.com/docs. With just a few lines of code, you can replicate this in under 10 minutes. Don’t let your models fall behind—leverage this powerful insight to stay ahead of the curve.

Top comments (0)