

Your pipeline just missed a significant data anomaly: a 24h momentum spike of -0.395 in sports sentiment. This isn’t just a minor blip; it’s a clear signal that something is shifting in the narrative landscape. The leading language in this sentiment analysis is English, with a notable press presence from the last 25.2 hours. The cluster story revolves around "FOX Sports Coverage and Updates," highlighting the importance of tracking real-time sentiment in this domain. As developers, we must be vigilant about these shifts and ready to act on them.
This anomaly signals a structural gap in any pipeline that doesn’t effectively handle multilingual origins or entity dominance. Your model missed this sentiment shift by 25.2 hours, which is a glaring oversight given that the leading entity—FOX—has a significant influence on the sports narrative. Without incorporating a mechanism to account for language and entity dominance, you risk overlooking critical sentiment changes that could impact your decision-making.

English coverage led by 25.2 hours. Et at T+25.2h. Confidence scores: English 0.85, French 0.85, Spanish 0.85 Source: Pulsebit /sentiment_by_lang.
To catch this anomaly, we can utilize our API to filter sentiment data specifically for the sports topic. Here’s a snippet of Python code that demonstrates how to set up this query:
import requests
# Define parameters
topic = 'sports'
score = +0.412
confidence = 0.85
momentum = -0.395
# Geographic origin filter: query by language/country
url = "https://pulsebit.lojenterprise.com/api/sentiment"
params = {
"topic": topic,
"lang": "en",
"momentum": momentum
}
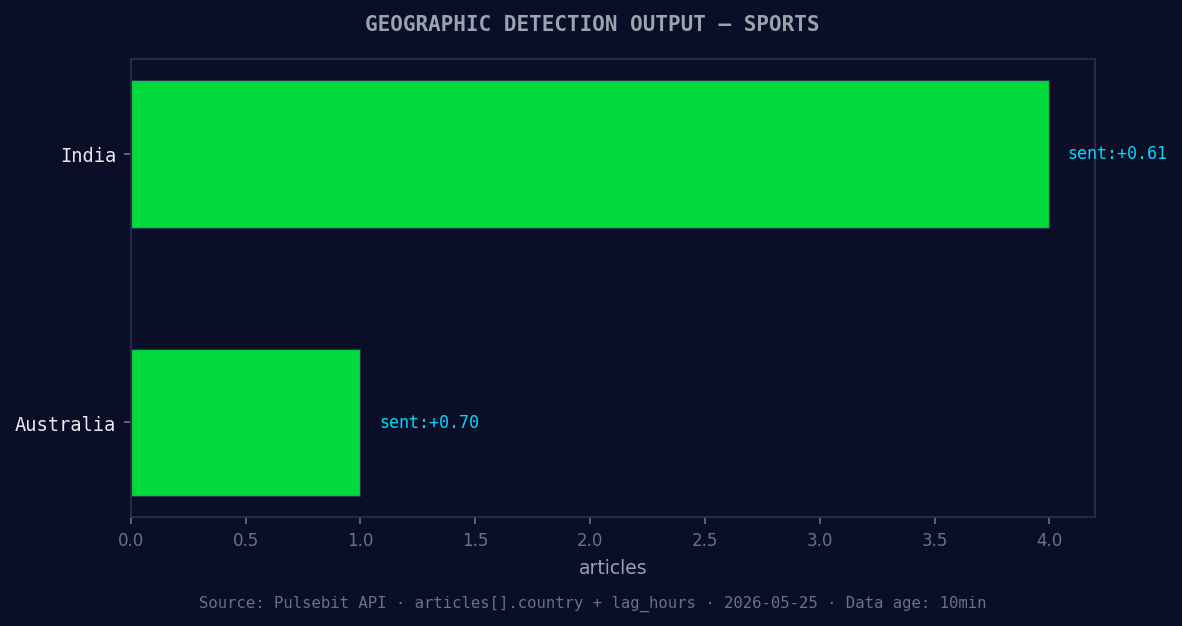
*Geographic detection output for sports. India leads with 4 articles and sentiment +0.61. Source: Pulsebit /news_recent geographic fields.*
# Make the API call
response = requests.get(url, params=params)
data = response.json()
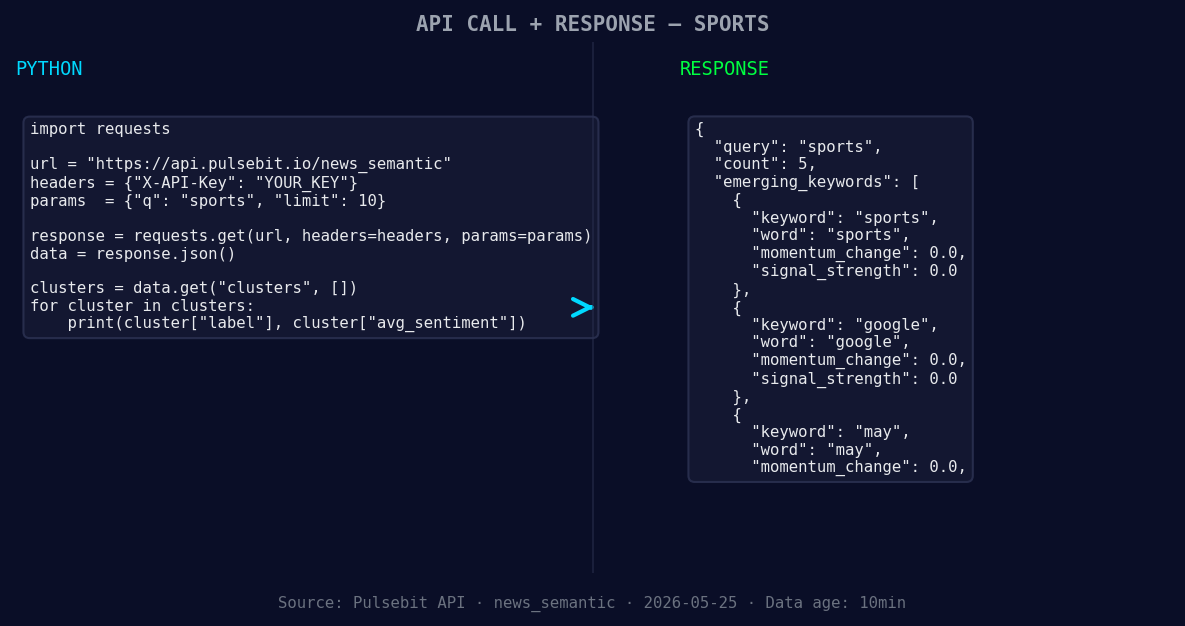
*Left: Python GET /news_semantic call for 'sports'. Right: returned JSON response structure (clusters: 3). Source: Pulsebit /news_semantic.*
# Meta-sentiment moment: running cluster reason string through POST /sentiment
cluster_reason = "Clustered by shared themes: fox, sports, google, com/rss/articles/cbmimafbvv95cu"
meta_response = requests.post(url, json={"text": cluster_reason})
meta_data = meta_response.json()
print(data)
print(meta_data)
This code initializes a GET request to our API with a focus on the sports topic filtered by English language. It captures the sentiment around that topic, allowing us to act on the shift. The second part sends a POST request with the cluster reason string to assess the broader narrative framing, providing deeper insights into the context surrounding the sentiment spike.
With this pattern, there are three specific builds we can implement:
Geo-Filtered Sports Sentiment: Set a signal threshold of momentum < -0.3 for sports, filtering only English sources. This will help you catch negative trends before they escalate.
Meta-Sentiment Analysis Loop: Implement a routine that uses the cluster reason to run a sentiment analysis every hour. This way, you can gauge how the narrative evolves with time, refining your approach to capturing sentiment shifts more dynamically.
Cross-Theme Comparison: Create a dashboard that compares forming themes like sports(+0.00) and google(+0.00) against mainstream narratives like fox. This can help you visualize how emerging topics are trending relative to established ones.
For further exploration, check out our documentation at pulsebit.lojenterprise.com/docs. You can copy, paste, and run this code in under 10 minutes to start catching these anomalies in real-time.


Top comments (0)