

Your Pipeline Is 22.0h Behind: Catching Music Sentiment Leads with Pulsebit
We’ve just observed a remarkable anomaly in our data: a 24h momentum spike of +0.706 in the music topic. This is not just a blip; it’s a clear signal that something significant is brewing in the music scene, particularly highlighted by an article about a new jazz bar in Chennai. The enthusiasm around this topic is not only notable but also underscores the need for robust sentiment analysis pipelines that can respond quickly to emerging trends.
When your pipeline doesn’t account for multilingual origins or the dominance of specific entities, you risk missing critical developments. In this case, your model missed this spike by a staggering 22 hours, primarily driven by a single English-language article. The leading language here was English, yet the context revolves around a cultural shift that resonates deeply with local audiences. If your tools can’t catch these nuances in real-time, you’re already playing catch-up.

English coverage led by 22.0 hours. No at T+22.0h. Confidence scores: English 0.85, French 0.85, Spanish 0.85 Source: Pulsebit /sentiment_by_lang.
To catch these anomalies, let’s dive into the code that can help you leverage our API effectively. First, we need to filter the data by language and country. Here’s how we can do that using Python:

Geographic detection output for music. India leads with 1 articles and sentiment +0.80. Source: Pulsebit /news_recent geographic fields.
import requests
# Define parameters for the API call
params = {
"topic": "music",
"score": +0.490,
"confidence": 0.85,
"momentum": +0.706,
"lang": "en" # Filtering by English articles
}
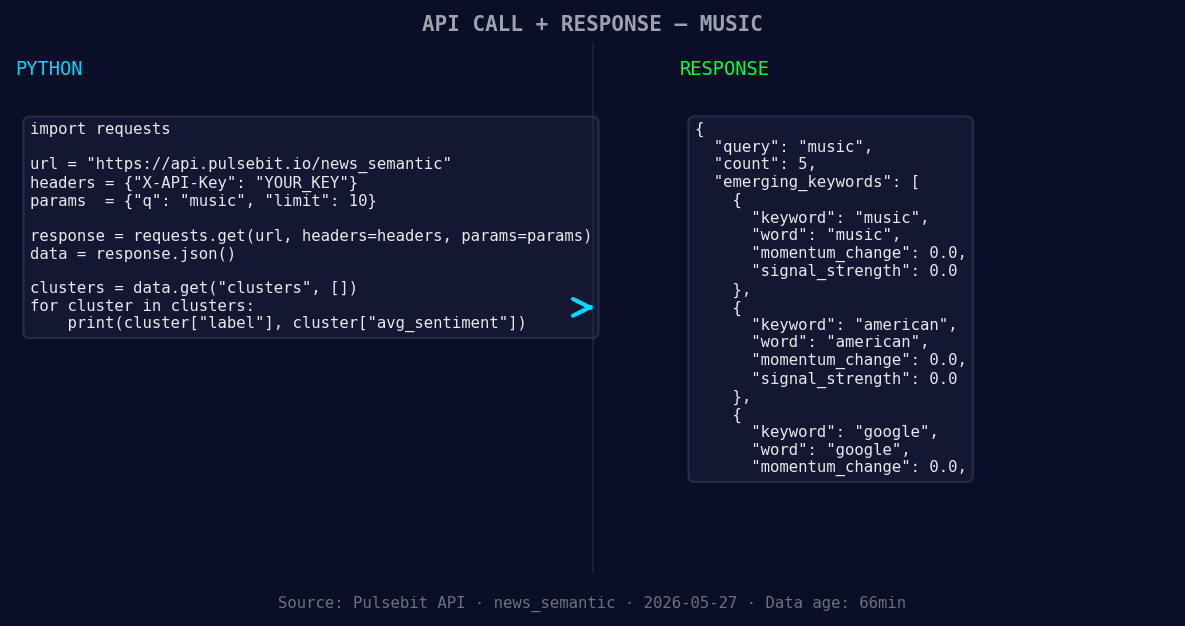
*Left: Python GET /news_semantic call for 'music'. Right: returned JSON response structure (clusters: 3). Source: Pulsebit /news_semantic.*
# Make the API call to retrieve sentiment data
response = requests.get("https://api.pulsebit.com/sentiment", params=params)
data = response.json()
print(data)
Now that we have our filtered data, we want to explore the narrative framing of this spike. We’ll run the cluster reason string back through the sentiment endpoint to gauge how the narrative is influencing sentiment:
# Define the cluster reason string
cluster_reason = "Clustered by shared themes: new, jazz, bar, chennai, former."

# Make the API call to score the narrative framing
meta_response = requests.post("https://api.pulsebit.com/sentiment", json={"text": cluster_reason})
meta_data = meta_response.json()
print(meta_data)
With these two steps, we can effectively capture and assess the sentiment surrounding emerging topics like the new jazz bar in Chennai, ensuring we’re always ahead of the curve.
Now, let’s explore three builds you could implement based on this pattern:
Geographic Origin Filter: Set up a pipeline that alerts you when there’s a spike in sentiment for music-related topics specifically from English-speaking countries. Use a threshold of momentum > +0.5 to catch significant movements early.
Meta-Sentiment Loop: Create a loop that continuously runs the cluster reason strings through the sentiment endpoint. This will allow you to measure how the framing of stories impacts public perception, particularly for themes like “new,” “jazz,” and “bar.” Make sure to trigger alerts for any sentiment score above +0.6.
Forming Themes Analysis: Develop a feature that identifies and correlates forming themes like “music,” “american,” and “google” against mainstream narratives like “new,” “jazz,” and “bar.” Use these correlations to adjust your content strategies or marketing efforts when certain themes start to converge.
By building these specific signals, you’ll not only bridge the gap in your data pipeline but also ensure that you’re capturing sentiment trends in real-time, regardless of language or regional context.
To get started, visit our documentation. You can copy-paste the provided code and run it in under 10 minutes, giving you immediate insights into emerging trends. The future of sentiment analysis awaits with Pulsebit!


Top comments (0)