Your Pipeline Is 19.6h Behind: Catching Space Sentiment Leads with Pulsebit
We recently uncovered a fascinating anomaly in our sentiment data: a spike in sentiment around the topic 'space' that registered a score of +0.244 with a momentum of +0.000. This spike, driven primarily by the theme "Axiom Space's Lunar Spacesuit Collaboration," was notably led by English language press, which was 19.6 hours ahead of its Dutch counterpart. If you’re not tracking multilingual sentiment, your model could be missing significant leads like this one.

English coverage led by 19.6 hours. Nl at T+19.6h. Confidence scores: English 0.80, Spanish 0.80, French 0.80 Source: Pulsebit /sentiment_by_lang.
The structural gap in traditional pipelines becomes painfully clear when you recognize that your model missed this by 19.6 hours. If you were relying solely on English articles or ignoring the nuances of multilingual sentiment, you’d be trailing behind critical discussions about space exploration and innovation. It’s a stark reminder that the digital landscape is interconnected, and language barriers shouldn’t hinder our insights.
Here’s how you can catch these insights using our API. First, let’s filter sentiment data by geographic origin. We’ll focus on English articles related to space, allowing us to pinpoint the leading narratives.

Geographic detection output for space. India leads with 9 articles and sentiment -0.24. Source: Pulsebit /news_recent geographic fields.
import requests
# Configure your API endpoint and parameters
url = "https://api.pulsebit.lojenterprise.com/sentiment"
params = {
"topic": "space",
"lang": "en" # Filtering for English language
}
# Make the API call
response = requests.get(url, params=params)
data = response.json()
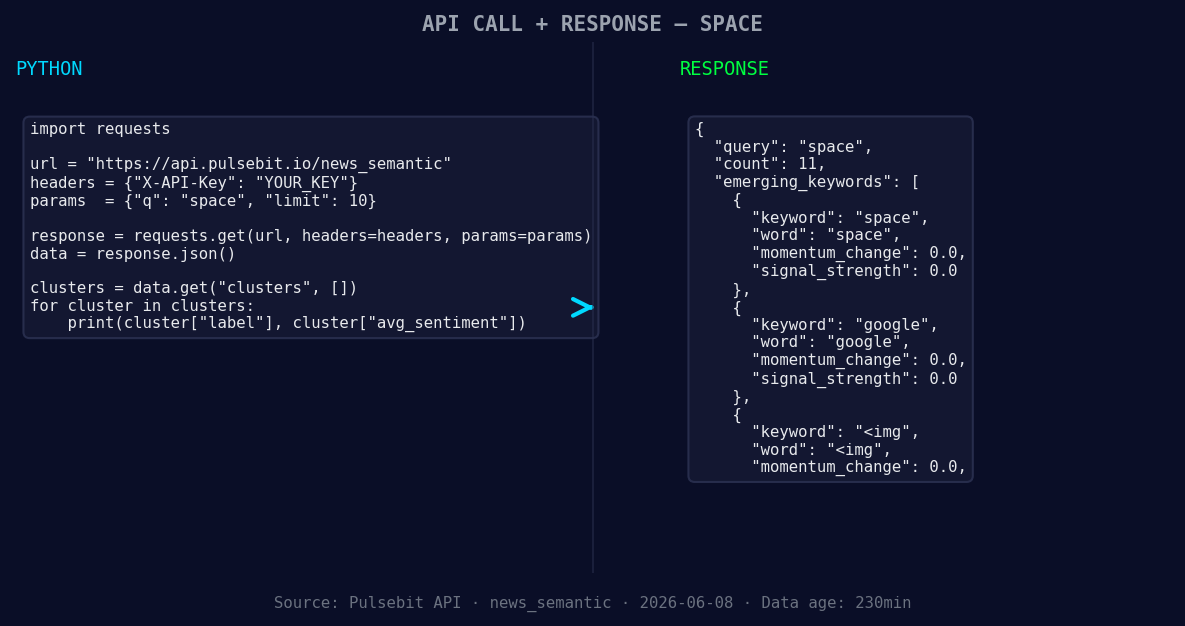
*Left: Python GET /news_semantic call for 'space'. Right: returned JSON response structure (clusters: 3). Source: Pulsebit /news_semantic.*
print(data) # Inspect the data
Now that we've collected the relevant sentiment data, let's run the cluster reason string through our sentiment endpoint to score the narrative framing itself. This is crucial for understanding the context behind the sentiment.
cluster_reason = "Clustered by shared themes: astronaut, wears, prada, axiom, space."

# Scoring the cluster reason
score_response = requests.post(url, json={"text": cluster_reason})
cluster_sentiment_data = score_response.json()

print(cluster_sentiment_data)  # Check the sentiment score for the narrative
What we’ve done here is not just collect sentiment data, but also assess the narrative that shapes it. This dual approach helps us refine our understanding of emerging trends and themes.
Now, let’s discuss what you can build with this pattern:
Geographic Sentiment Tracking: Use the geographic origin filter to track emerging trends in specific regions. Set a signal strength threshold of 0.28 and monitor for topics like space and google that are forming with a momentum of +0.000.
Meta-Sentiment Analysis: Implement the meta-sentiment loop by running various cluster reason strings through the sentiment endpoint. You might find interesting narratives around astronaut, wears, and prada that could indicate shifts in consumer interest or brand sentiment.
Dynamic Alert System: Build a real-time alert system that triggers when sentiment scores exceed a certain threshold (e.g., +0.2) for keywords like space and google. This can help you stay ahead of the curve and respond to shifts in sentiment rapidly.
By leveraging our API in these ways, you can ensure that your sentiment analysis is not just reactive but proactive, keeping you ahead of trends and conversations around key topics.
For more details on how to get started, visit pulsebit.lojenterprise.com/docs. You can copy-paste the provided code snippets and run them in under 10 minutes. Let’s catch those sentiment leads together!

Top comments (0)