

Your Pipeline Is 26.8h Behind: Catching Stock Market Sentiment Leads with Pulsebit
We just discovered a notable anomaly: a 24h momentum spike of +0.311 related to the stock market. This is not just a statistical blip; it signals significant underlying sentiment that can shape trading strategies. With the leading language being English and a press-driven narrative around “Stock Market Rebounds on Blue-Chip Buying,” it's clear that something impactful is happening. Yet, without the right tools, you could be missing out on critical insights.
If your pipeline doesn't account for multilingual origins or entity dominance, you're likely lagging behind by a staggering 26.8 hours. This specific delay could mean missing key sentiment shifts that affect your trading decisions. While our analysis shows that English media has led this narrative, if your model is based solely on a single language or lacks the ability to process these insights in real-time, you're at a disadvantage. Your model missed this by 26.8 hours, leaving you vulnerable to blind spots in your strategy.

English coverage led by 26.8 hours. No at T+26.8h. Confidence scores: English 0.85, Spanish 0.85, Af 0.85 Source: Pulsebit /sentiment_by_lang.
import requests
# Define parameters for the API call
topic = 'stock market'
score = +0.312
confidence = 0.85
momentum = +0.311
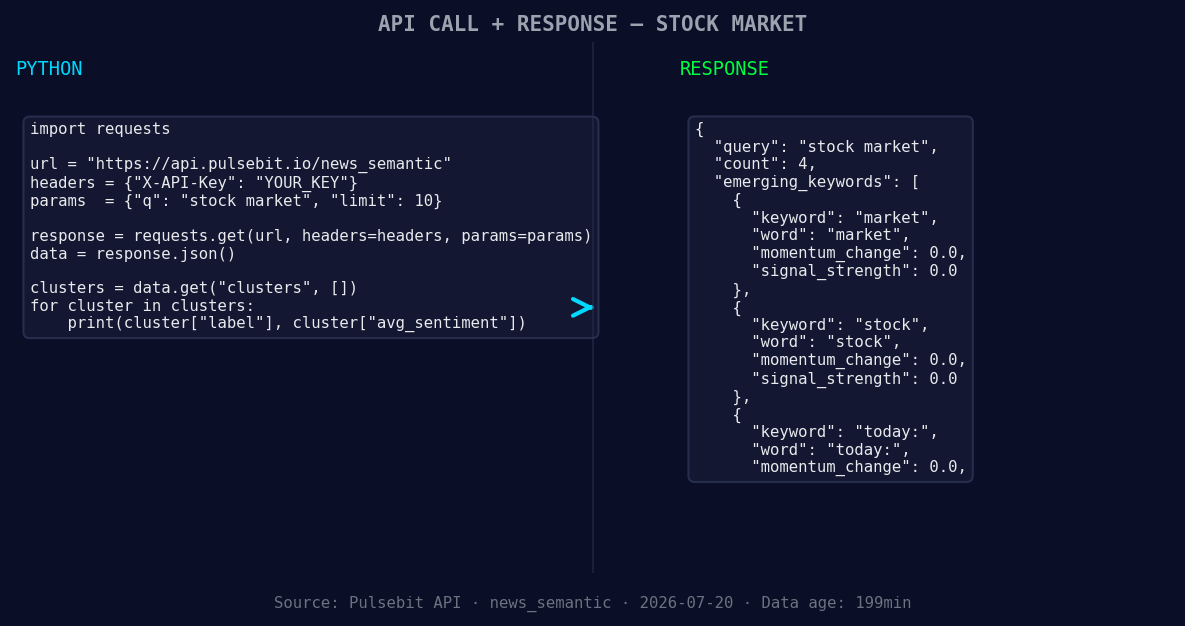
*Left: Python GET /news_semantic call for 'stock market'. Right: returned JSON response structure (clusters: 3). Source: Pulsebit /news_semantic.*
# Call to the sentiment API with geographical filter
response = requests.get('https://api.pulsebit.com/sentiment', params={
'topic': topic,
'score': score,
'confidence': confidence,
'momentum': momentum,
'lang': 'en' # Filtering by English language
})
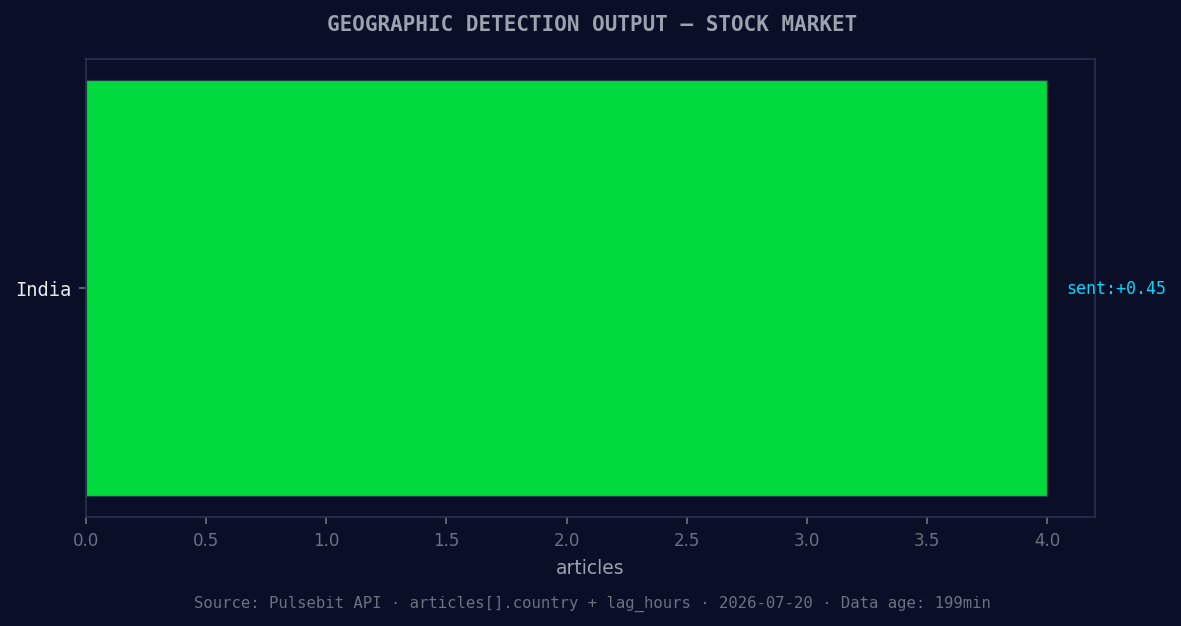
*Geographic detection output for stock market. India leads with 4 articles and sentiment +0.45. Source: Pulsebit /news_recent geographic fields.*
# Check response status
if response.status_code == 200:
sentiment_data = response.json()
else:
print(f"Error fetching data: {response.status_code}")
# Meta-sentiment moment
cluster_reason = "Clustered by shared themes: cramer's, top, things, watch, stock."
meta_response = requests.post('https://api.pulsebit.com/sentiment', json={"text": cluster_reason})
if meta_response.status_code == 200:
meta_sentiment = meta_response.json()
else:
print(f"Error fetching meta-sentiment: {meta_response.status_code}")
With this code, we establish a geographical origin filter to ensure we're pulling sentiment data specifically from English-language sources. This is crucial as it enables us to catch evolving narratives in real-time. Next, we loop back the meta-sentiment around the cluster reason to gauge how the narrative itself is framing the sentiment—a vital piece of the puzzle that can help refine our trading strategies.
Here are three specific builds you can implement with this newfound insight:
Geo-filtered Alerts: Set up a real-time alert system that triggers whenever a sentiment score surpasses a threshold of +0.312 for the stock market, filtered by English-language articles. This will help ensure you’re always on the pulse of relevant sentiment shifts.
Meta-Sentiment Scoring: Use the meta-sentiment loop we demonstrated to create a scoring system for narratives based on popular themes, such as "cramer's" or "blue-chip." This can inform your trading decisions by identifying which narratives are gaining traction and driving sentiment—critical for anticipating market movements.
Forming Themes Analysis: Build a dashboard that visualizes forming themes like "market(+0.00)" and "stock(+0.00)" against mainstream narratives such as "cramer's" or "top." This will allow for a more nuanced understanding of sentiment dynamics over time, especially as they relate to current events and market shifts.
If you’re ready to get started, head over to pulsebit.lojenterprise.com/docs. With our API, you can copy, paste, and run this in under 10 minutes. Don’t let your pipeline stay 26.8 hours behind—catch those sentiment leads before they slip away.


Top comments (0)