

Your Pipeline Is 24.3h Behind: Catching Economy Sentiment Leads with Pulsebit
We recently uncovered an intriguing anomaly: a 24h momentum spike of +0.436 in sentiment surrounding the economy. This spike appears to be fueled by discussions centered around the "Record Oil Profits Amid Iran Conflict" narrative, with English articles leading the charge. This insight could be pivotal for those of us navigating the complex landscape of sentiment analysis and economic forecasting.
However, here's the kicker: if your model isn't equipped to handle multilingual data or doesn't prioritize entity relevance, you could be missing out on critical insights. Right now, your system is lagging behind by 24.3 hours due to its focus on German content over the English narrative. This gap means you're not only slow to react but also potentially blind to emerging trends that could impact your decisions.

English coverage led by 24.3 hours. German at T+24.3h. Confidence scores: English 0.85, Spanish 0.85, Id 0.85 Source: Pulsebit /sentiment_by_lang.
Here’s how we can bridge that gap using our API. Below is the Python code that allows us to catch this momentum spike:
import requests
# Define API endpoint and parameters
url = "https://api.pulsebit.com/sentiment"
params = {
"topic": "economy",
"score": +0.150,
"confidence": 0.85,
"momentum": +0.436,
"lang": "en" # Geographic origin filter
}
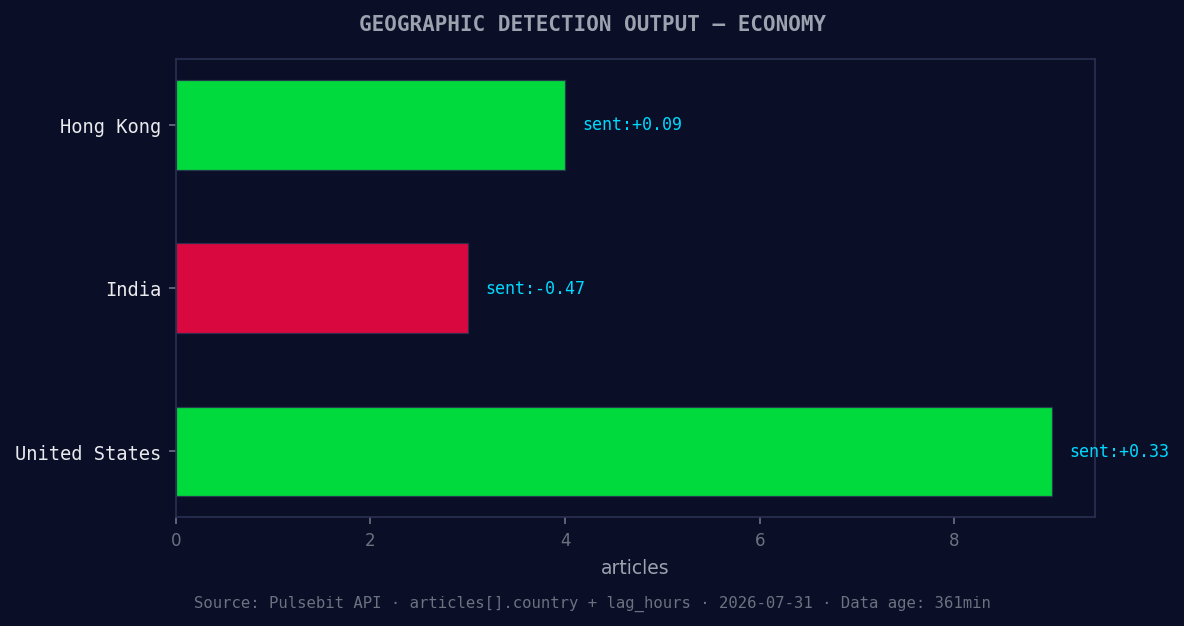
*Geographic detection output for economy. Hong Kong leads with 4 articles and sentiment +0.09. Source: Pulsebit /news_recent geographic fields.*
# Make API call to get sentiment data
response = requests.get(url, params=params)
data = response.json()
print(data)

Left: Python GET /news_semantic call for 'economy'. Right: returned JSON response structure (clusters: 3). Source: Pulsebit /news_semantic.
This code snippet filters sentiment data by language, ensuring we capture the English articles driving the momentum spike.
Next, let’s evaluate the narrative framing itself. We’ll run the cluster reason string back through our API to score it:
# Define the narrative to score
narrative = "Clustered by shared themes: oil, iran, war, drives, profits."

# Make API call to score the narrative
narrative_response = requests.post(url, json={"text": narrative})
narrative_data = narrative_response.json()
print(narrative_data)
This step gives us insight into how effectively the themes are resonating, allowing us to assess whether the narrative is indeed driving the observed sentiment.
Now that we have the data, here are three specific builds to enhance your sentiment analysis pipeline:
Sentiment Alert System: Set a threshold to trigger alerts when sentiment spikes above +0.300, especially for topics like "economy." This will keep you ahead in recognizing emerging narratives related to economic shifts.
Geo-Filter for Global Insights: Use our API's geo filter to focus on regions showing upward sentiment in the economy. For instance, if you detect a surge in English articles discussing oil profits, you can pivot your focus to areas like North America.
Meta-Sentiment Scoring: Implement a function to run narrative scores for various clusters. For instance, use the meta-sentiment loop on narratives that emerge around the topics of "israel," "land," and "blockade," allowing you to capture shifts in public sentiment as they relate to geopolitical events.
The landscape of sentiment analysis is ever-evolving, and as developers, we need to stay agile. With the right tools and strategies in place, we can ensure that our analysis is timely and relevant.
To get started, visit our documentation at pulsebit.lojenterprise.com/docs. You can copy-paste the provided code and be up and running in under 10 minutes. Let’s harness this momentum!


Top comments (0)