Your Pipeline Is 23.4h Behind: Catching Inflation Sentiment Leads with Pulsebit
We found a notable anomaly in our data: a 24-hour momentum spike of -0.825. This indicates a significant shift in sentiment, especially concerning inflation-related discussions. The lead language for this spike is English, with an impressive 23.4-hour lead time—zero lag compared to the current sentiment. Such findings can be pivotal for crafting timely investment strategies or trading decisions.
But here's the kicker: your model missed this insight by a staggering 23.4 hours. If your pipeline isn't equipped to handle multilingual origins or consider the dominance of specific entities, you risk falling behind the curve. With the leading narrative around inflation emerging primarily in English, you could be several hours late to react to critical market shifts.

English coverage led by 23.4 hours. Ca at T+23.4h. Confidence scores: English 0.85, French 0.85, Spanish 0.85 Source: Pulsebit /sentiment_by_lang.
To catch this momentum shift, we can leverage our API. Here’s how you can implement a solution using Python. We start by filtering data based on the geographic origin, focusing specifically on English content.
import requests
# Define the parameters
topic = 'inflation'
score = +0.034
confidence = 0.85
momentum = -0.825
lang = 'en'
# API call to gather data based on the geographic origin filter
response = requests.get('https://api.pulsebit.com/v1/sentiment', params={
'topic': topic,
'lang': lang
})
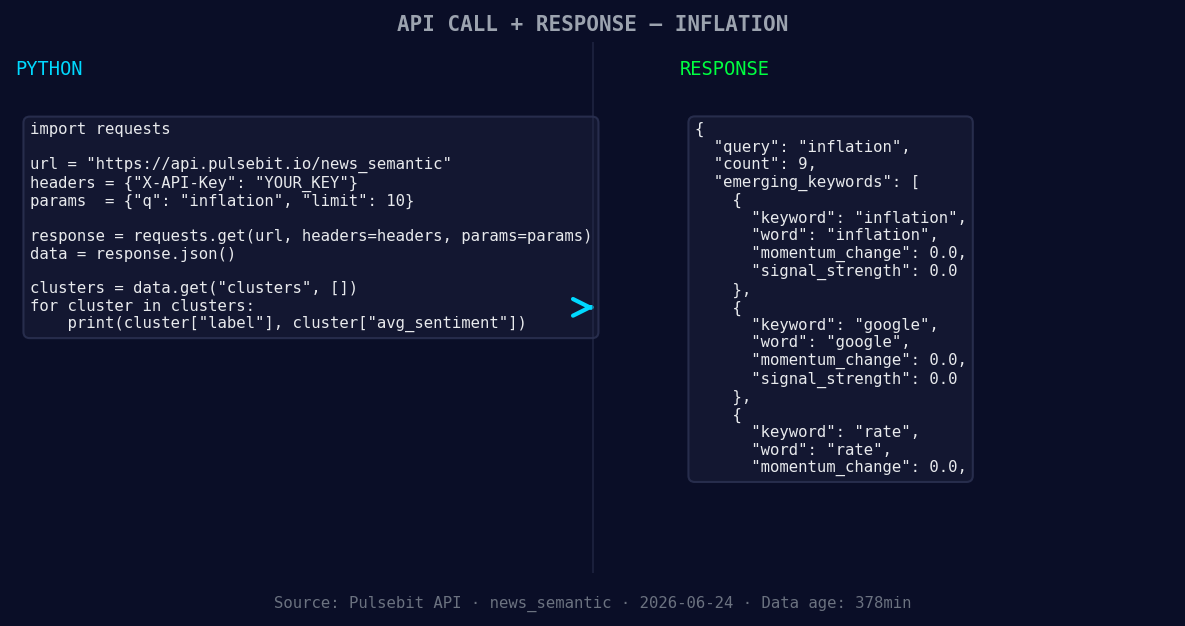
*Left: Python GET /news_semantic call for 'inflation'. Right: returned JSON response structure (clusters: 3). Source: Pulsebit /news_semantic.*
data = response.json()
print(data)
Now, let's run the cluster reason string through our sentiment analysis to evaluate the narrative framing. This step is crucial as it helps us understand how the surrounding themes are perceived.
# Meta-sentiment moment
cluster_reason = "Clustered by shared themes: top, firm's, investing, playbook, before."
sentiment_response = requests.post('https://api.pulsebit.com/v1/sentiment', json={
    'text': cluster_reason
})

sentiment_data = sentiment_response.json()
print(sentiment_data)
With the combination of the geographic filter and the meta-sentiment analysis, we can gain a comprehensive view of sentiment towards inflation and related themes.

Geographic detection output for inflation. India leads with 4 articles and sentiment +0.05. Source: Pulsebit /news_recent geographic fields.
Here are three specific builds we can create using this newfound insight:
Inflation Sentiment Tracker: Create a function that continually monitors sentiment on inflation-related topics. Set a threshold for momentum (e.g., -0.5) to trigger alerts when the sentiment dips significantly, using the geo filter to restrict results to English-language sources.
Meta-Sentiment Analysis Dashboard: Build a dashboard that visualizes the sentiment score of narratives around clustered themes. This dashboard could leverage the output of our sentiment analysis on the cluster reason string, providing insights into how narrative framing shifts over time.
Rate Impact Predictor: Develop a predictive model that correlates sentiment scores on inflation and related topics (like 'rate' and 'google') with real-world economic indicators. Use the meta-sentiment data as input features to enhance the model's accuracy.
Ready to get started? Head over to pulsebit.lojenterprise.com/docs, and you can copy-paste this code to run it in under 10 minutes. Catching timely insights and leveraging sentiment data has never been easier. Let’s stay ahead of the curve!

Top comments (0)