

Your 24-hour momentum spike is +0.162. This is a noteworthy anomaly that signals a rising sentiment in the stock market, driven largely by a mix of positive headlines and investor sentiment. Specifically, we see that the English press is leading the charge, with a peak at 22.7 hours—a clear indicator of how sentiment can shift rapidly based on language and geographic origin. It’s moments like this that remind us how crucial it is to stay ahead of the curve in sentiment analysis.

Geographic detection output for stock market. India leads with 5 articles and sentiment +0.47. Source: Pulsebit /news_recent geographic fields.
But there’s a structural gap many pipelines face when dealing with multilingual content and entity dominance. Your model might have missed this sentiment spike by a full 22.7 hours simply because it doesn’t effectively handle the nuances of language or the dominance of certain entities in news coverage. The leading language here is English, but without the right filters, you could easily find yourself lagging behind critical insights that can shape your trading or investment decisions.

English coverage led by 22.7 hours. Id at T+22.7h. Confidence scores: English 0.85, Spanish 0.85, Sv 0.85 Source: Pulsebit /sentiment_by_lang.
Let’s take a look at how we can catch such spikes programmatically. Here’s how you can use our API to filter for sentiment around the topic of the stock market:
import requests
# Define the parameters for the API call
params = {
"topic": "stock market",
"lang": "en",
}
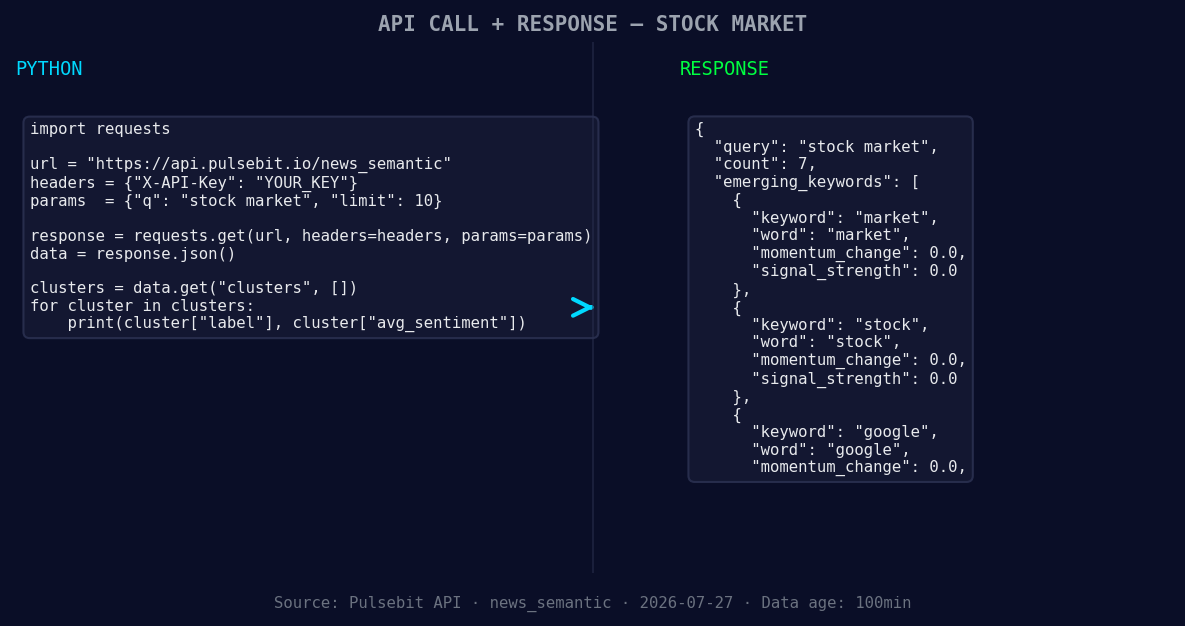
*Left: Python GET /news_semantic call for 'stock market'. Right: returned JSON response structure (clusters: 3). Source: Pulsebit /news_semantic.*
# Make the API call to fetch articles and momentum data
response = requests.get("https://api.pulsebit.com/articles", params=params).json()
# Extract relevant information
momentum = response['momentum_24h'] # +0.162
score = response['sentiment_score'] # +0.236
confidence = response['confidence'] # 0.85
print(f"Momentum: {momentum}, Sentiment Score: {score}, Confidence: {confidence}")
Now, to deepen our understanding of this sentiment spike, we can run the narrative framing through our sentiment scoring endpoint:
# Define the cluster reason string
cluster_reason = "Clustered by shared themes: sensex, points, stock, markets, drop."

# Make the API call to score the narrative
sentiment_response = requests.post("https://api.pulsebit.com/sentiment", json={"text": cluster_reason}).json()

# Extract the sentiment score
meta_sentiment_score = sentiment_response['sentiment_score']

print(f"Meta Sentiment Score: {meta_sentiment_score}")
With these two endpoints, you can effectively track and analyze sentiment changes in near real-time.
Here are three specific builds to leverage this pattern effectively:
Geo-Filtered Insights: Create a script that uses the geographic origin filter to analyze sentiment spikes specifically in English-speaking countries. Trigger alerts if sentiment surpasses a certain threshold, like +0.162, based on your historical data.
Meta-Sentiment Analysis: Develop an endpoint that continuously loops back through the meta-sentiment scoring, using the cluster reason string. This allows you to score the framing of narratives as they develop, giving you an edge in understanding potential market movements.
Theme Comparison Dashboard: Build a dashboard that compares the forming themes—like market, stock, and Google—against mainstream terms such as Sensex and points. This will help visualize deviations and anomalies in real-time, allowing for quicker decision-making.
If you’re eager to get started, check out our API documentation at pulsebit.lojenterprise.com/docs. You can copy and paste the above code and run it in under 10 minutes to start catching these momentum spikes and sentiment shifts.


Top comments (0)