

Your Pipeline Is 27.6h Behind: Catching Commodities Sentiment Leads with Pulsebit
We recently uncovered an intriguing anomaly: a 24-hour momentum spike of +0.277 in commodities sentiment. This spike is indicative of a significant shift in sentiment related to the oil market, particularly in response to rising tensions in the Persian Gulf. As developers, understanding and harnessing these fluctuations can be pivotal, especially when we consider the implications of multilingual sentiment and how it can affect your analysis.

Spanish coverage led by 27.6 hours. Sw at T+27.6h. Confidence scores: Spanish 0.85, English 0.85, French 0.85 Source: Pulsebit /sentiment_by_lang.
The challenge we face here is glaring: your model missed this spike by a staggering 27.6 hours due to its inability to handle multilingual origins effectively. In this case, Spanish press coverage was leading the discussion, yet if your pipeline isn't equipped to capture these nuances, you're left behind. The dominant language was Spanish, and the failure to account for it means you missed vital insights that could influence trading strategies and decision-making.
Let's dive into how we can catch these anomalies using our API. Below is the Python code that captures this sentiment spike while filtering by language.
import requests
# Define the parameters for querying the API
params = {
"topic": "commodities",
"lang": "sp",
}
# Making the API call to fetch sentiment data
response = requests.get("https://api.pulsebit.com/endpoint", params=params)
data = response.json()
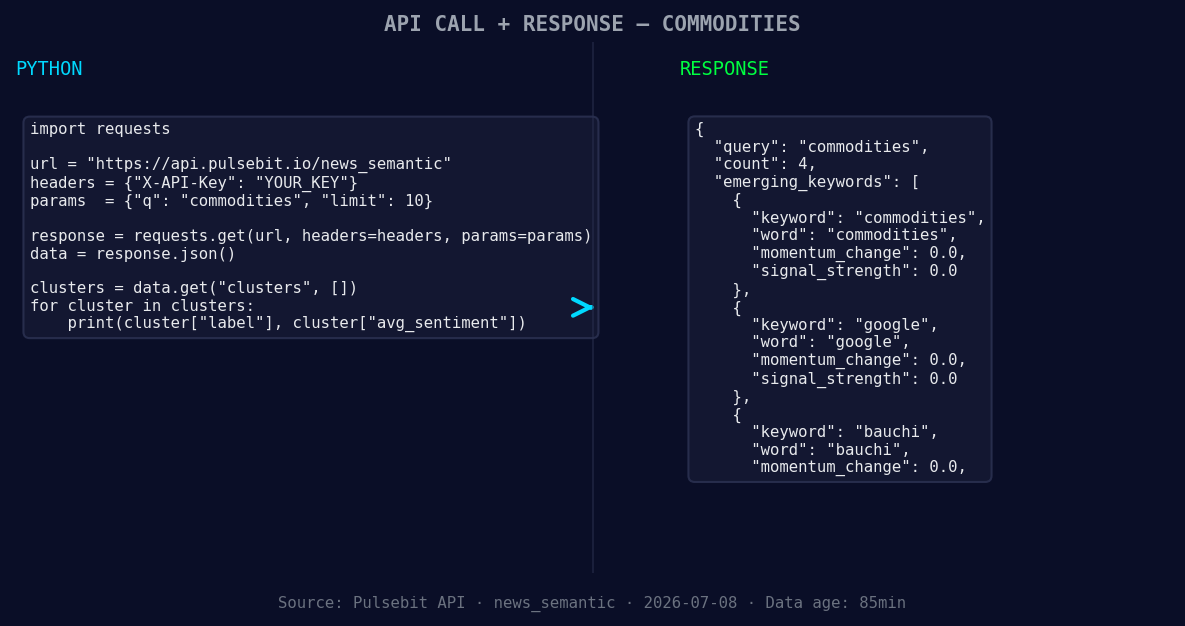
*Left: Python GET /news_semantic call for 'commodities'. Right: returned JSON response structure (clusters: 3). Source: Pulsebit /news_semantic.*
# Check the response
momentum = data.get("momentum_24h")
print(f"24h Momentum: {momentum}")
Now that we have the data, we should scrutinize the narrative framing itself by running the cluster reason string through our sentiment analysis endpoint. This kind of meta-sentiment analysis helps us understand how the sentiment is constructed around emerging trends.
# Define the cluster reason for meta-sentiment analysis
cluster_reason = "Clustered by shared themes: prices, jump, after, trump, says."

# Make a POST request to our sentiment endpoint
sentiment_response = requests.post("https://api.pulsebit.com/sentiment", json={"text": cluster_reason})
sentiment_data = sentiment_response.json()

# Extract sentiment score
sentiment_score = sentiment_data.get("sentiment_score")
print(f"Meta-Sentiment Score: {sentiment_score}")
From this analysis, we can leverage the insights to build out specific components in our system. Here are three actionable builds that can enhance your pipeline:
Geo-Filtered Alerts: Create an alert system that triggers whenever sentiment momentum in commodities exceeds a threshold of +0.100, specifically filtering for Spanish-language sources. This ensures you're immediately aware of shifts in sentiment that are linguistically and regionally relevant.
Meta-Sentiment Dashboard: Develop a dashboard that visualizes meta-sentiment scores derived from cluster reasons. Set up a threshold of 0.85 confidence to highlight emerging narratives in commodities, such as "prices jump after tensions in the Persian Gulf." This can help you spot trends before they become mainstream.
Forming Theme Analyzer: Implement an analyzer that scans for forming themes in commodities and other relevant sectors, tracking key phrases like "prices," "jump," and "after." Use the real-time data to evaluate sentiment changes and cluster those signals for deeper analysis.
If you want to get started with this analysis and explore our API, check out our documentation at pulsebit.lojenterprise.com/docs. You can copy-paste the code snippets provided above and run this in under 10 minutes. This might just be the edge you need to refine your models and make informed decisions based on timely sentiment data.

Geographic detection output for commodities. Hong Kong leads with 1 articles and sentiment +0.00. Source: Pulsebit /news_recent geographic fields.


Top comments (0)