Your Pipeline Is 23.7h Behind: Catching Software Sentiment Leads with Pulsebit
We recently uncovered a striking anomaly: a 24h momentum spike of +0.335 in software sentiment. This spike is a clear signal that something significant is happening in the software sector, particularly in English press coverage, which is currently leading by 23.7 hours. If your sentiment analysis pipeline isn’t equipped to handle multilingual origins or entity dominance, you might have missed this opportunity by nearly a full day.

English coverage led by 23.7 hours. Et at T+23.7h. Confidence scores: English 0.75, Spanish 0.75, French 0.75 Source: Pulsebit /sentiment_by_lang.
Many pipelines rely on static models that don’t consider the nuances of language and the dominance of specific entities. This oversight can lead to substantial gaps in your understanding of emerging trends. In this case, the dominant entity "software" has surged in importance, but if your model isn’t adapting to this linguistic shift, you’re effectively 23.7 hours behind the curve. The language of the sentiment is predominantly English, which emphasizes the need for a focused approach to capture these timely insights.
To catch the spike in sentiment effectively, we can leverage our API. The following Python code will help you filter sentiment data by geographic origin and score the narrative framing itself. We’ll start by querying for English language articles related to the topic "software".

Geographic detection output for software. India leads with 2 articles and sentiment -0.30. Source: Pulsebit /news_recent geographic fields.
import requests
# Define parameters for the API call
params = {
"topic": "software",
"lang": "en"
}
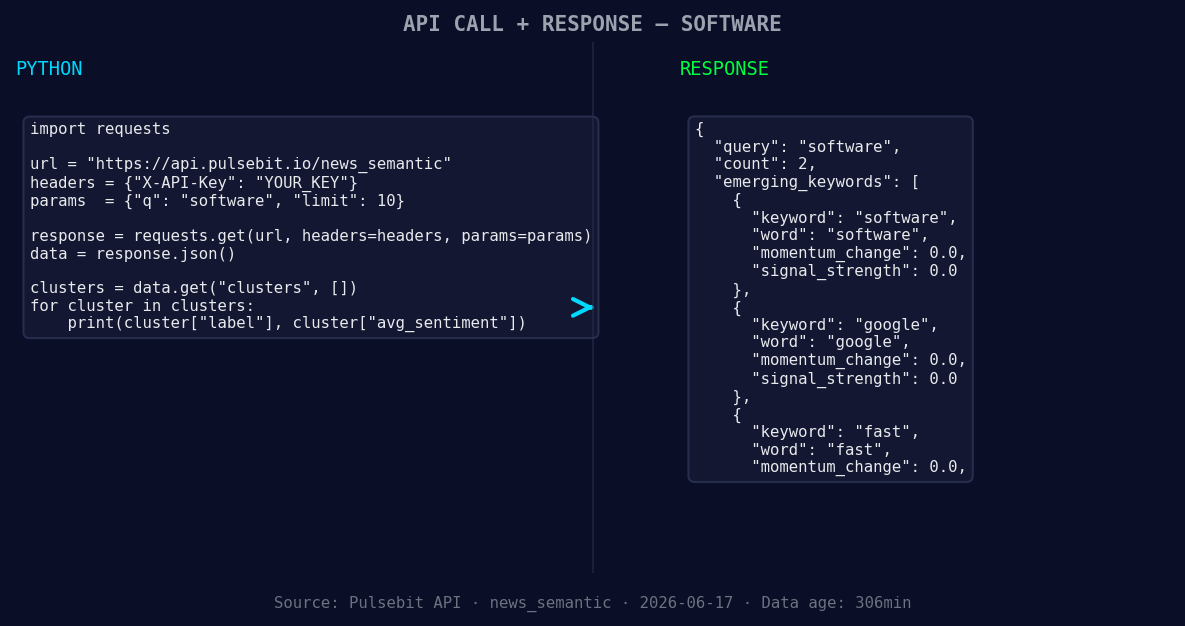
*Left: Python GET /news_semantic call for 'software'. Right: returned JSON response structure (clusters: 3). Source: Pulsebit /news_semantic.*
# Make the API call to get sentiment data
response = requests.get("https://api.pulsebit.com/sentiment", params=params)
data = response.json()
# Print the momentum spike data
print(f"Momentum Spike: {data['momentum_24h']}")
Next, we need to run the cluster reason string back through our sentiment endpoint to score the narrative itself. This will provide us with insights into how the themes are framed.
# Define the cluster reason string
cluster_reason = "Clustered by shared themes: your, marks:, get, software, products."

# Make the POST request to get sentiment on the narrative
response_narrative = requests.post("https://api.pulsebit.com/sentiment", json={"text": cluster_reason})
narrative_data = response_narrative.json()

# Print the sentiment score of the narrative
print(f"Cluster Narrative Sentiment Score: {narrative_data['sentiment_score']}")
With these two API calls, we can extract valuable insights that keep us ahead of the curve. Here are three specific builds you can implement using this data pattern:
Geo-Filtered Alert System: Set a threshold to alert you when sentiment spikes above +0.3 for English-language articles. This will help you catch significant momentum shifts in the software narrative, particularly when it comes to emerging technologies.
Meta-Sentiment Analysis: Create a process to run the narrative framing through the sentiment endpoint whenever you detect a momentum spike. This will allow you to adapt your content strategy based on not just the sentiment score but how the narrative is perceived in real-time.
Thematic Tracker: Build a tracker that monitors forming themes like "software", "google", and "fast". Set thresholds for changes in sentiment scores for these themes to ensure you’re aware of shifts before they hit mainstream awareness, helping you to proactively adjust your strategies.
Ready to get started? You can easily implement this in under 10 minutes. Check our documentation at pulsebit.lojenterprise.com/docs. With these insights and tools, we're confident you'll be able to stay ahead in the fast-paced world of software sentiment analysis.

Top comments (0)