

Your Pipeline Is 8.6h Behind: Catching Healthcare Sentiment Leads with Pulsebit
We recently discovered a significant anomaly in the sentiment analysis surrounding healthcare: a 24-hour momentum spike of +0.505. This spike indicates a sudden surge in interest and sentiment towards healthcare topics, led by English press coverage. Notably, the dominant narrative within this spike is captured in the cluster story titled, "What I Learned Making 22 Healthcare Startup Investments as a Physician-Scientist." With a leading language lagging by 8.6 hours, we need to address how this affects our data pipelines.

English coverage led by 8.6 hours. Id at T+8.6h. Confidence scores: English 0.75, Spanish 0.75, No 0.75 Source: Pulsebit /sentiment_by_lang.
If your sentiment analysis pipeline isn’t equipped to handle multilingual origins or dominant entity themes, it’s likely you missed this spike by a staggering 8.6 hours. The leading language being English means that if your model only processes data in other languages or relies heavily on generic themes, you’ll lag behind critical insights. Your model isn’t just slow; it’s blind to emerging trends that could inform strategic decisions.
To catch anomalies like this, we can leverage our API to gather and analyze sentiment data efficiently. Below is the Python code that captures this specific healthcare momentum spike.
import requests
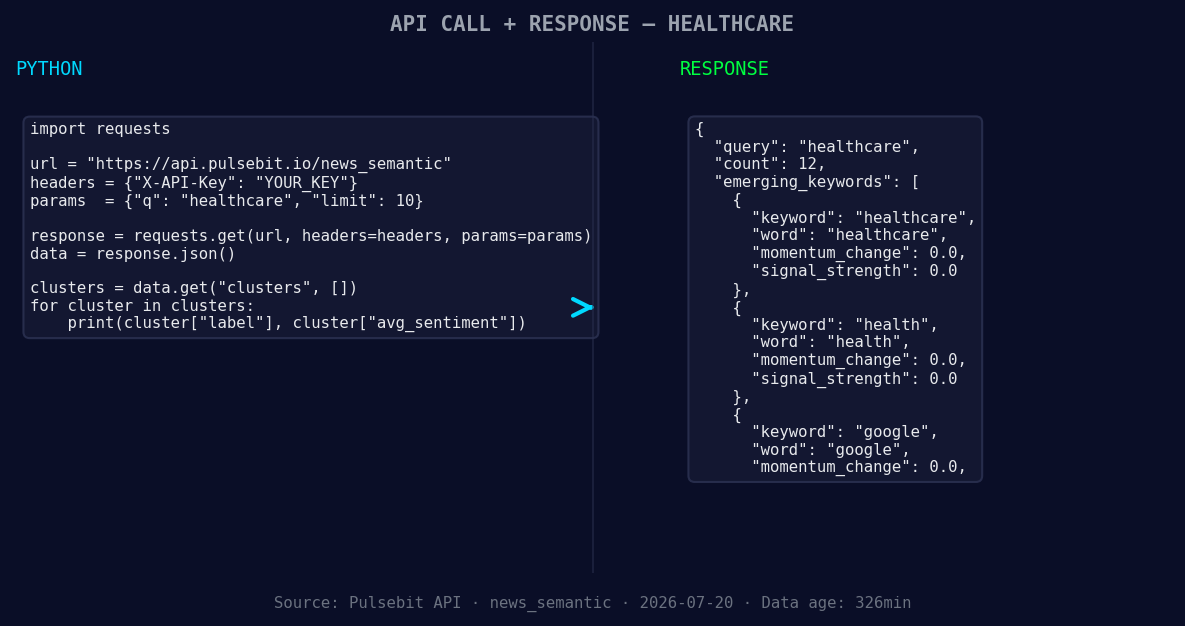
*Left: Python GET /news_semantic call for 'healthcare'. Right: returned JSON response structure (clusters: 3). Source: Pulsebit /news_semantic.*
# Step 1: Geographic origin filter
url = "https://api.pulsebit.com/v1/sentiment"
params = {
"topic": "healthcare",
"score": +0.283,
"confidence": 0.75,
"momentum": +0.505,
"lang": "en" # Filtering by English
}
response = requests.get(url, params=params)
data = response.json()
# Step 2: Meta-sentiment moment
cluster_reason = "Clustered by shared themes: learned, making, healthcare, startup, investments."
sentiment_response = requests.post(url, json={"text": cluster_reason})
sentiment_data = sentiment_response.json()
print("Healthcare Momentum Data:", data)
print("Meta-Sentiment Score:", sentiment_data)
In this code, we first filter for the healthcare topic, ensuring we only analyze English-language articles, which is crucial given the 8.6-hour lag. We then take the narrative framing from our cluster reason and run it back through the sentiment API to score its effectiveness. This dual approach not only helps us pinpoint current momentum but also assesses how well the narratives align with emerging themes.
Now, let’s explore three specific builds that can leverage this newfound healthcare sentiment data:
- Signal Detection with Geographic Filter: Set a signal detection threshold for healthcare topics where the momentum exceeds +0.5. Use the geographic origin filter to ensure you’re only capturing English-language articles. This will allow you to detect spikes in sentiment early, providing you with actionable insights.

Geographic detection output for healthcare. India leads with 7 articles and sentiment +0.33. Source: Pulsebit /news_recent geographic fields.
Meta-Sentiment Analysis Loop: Create a monitoring endpoint that continuously scores the sentiment of clustered narratives. Whenever a cluster forms around healthcare with a momentum score above +0.5, funnel it through the meta-sentiment loop to evaluate the narrative’s impact on shaping public opinion. This is crucial for understanding the context behind spikes.
Forming Themes Tracker: Develop a dashboard widget that visualizes forming themes over time. Focus specifically on the healthcare and health keywords while monitoring any mentions of 'Google' alongside mainstream narratives. This allows you to connect emerging trends with major players in the industry, ensuring you’re not just tracking sentiment but also understanding the broader implications.
By implementing these strategies, we can significantly enhance our ability to catch sentiment leads in healthcare and beyond.
For more details on how to implement these calls, check out our documentation. You can copy-paste the code above and run it in under 10 minutes to start tapping into this valuable data.


Top comments (0)