

Your Pipeline Is 26.7h Behind: Catching Health Sentiment Leads with Pulsebit
We recently uncovered an intriguing anomaly in our sentiment analysis: a 24h momentum spike of -0.750. This drop suggests that the sentiment around health topics is taking a downturn, which can have significant implications for your data pipeline and model responsiveness. With the leading language being English, and the dominant entity clustered around health, it’s clear that there’s a story here that you might be missing.
The problem is glaring. Your model missed this critical health sentiment shift by 26.7 hours. In a fast-paced environment where timely insights are crucial, that lag can render your analysis less relevant. With the dominant narrative around health being shaped in English, any pipeline that doesn’t effectively handle multilingual origins or entity dominance may leave you vulnerable to missed opportunities and misinterpretations of sentiment.

English coverage led by 26.7 hours. Af at T+26.7h. Confidence scores: English 0.75, Spanish 0.75, Id 0.75 Source: Pulsebit /sentiment_by_lang.
To catch this anomaly, we can use our API to filter out the relevant data. Here's how we can do it in Python:
import requests
# Define the API endpoint and parameters
url = "https://api.pulsebit.com/sentiment"
params = {
"topic": "health",
"lang": "en" # Geographic origin filter
}
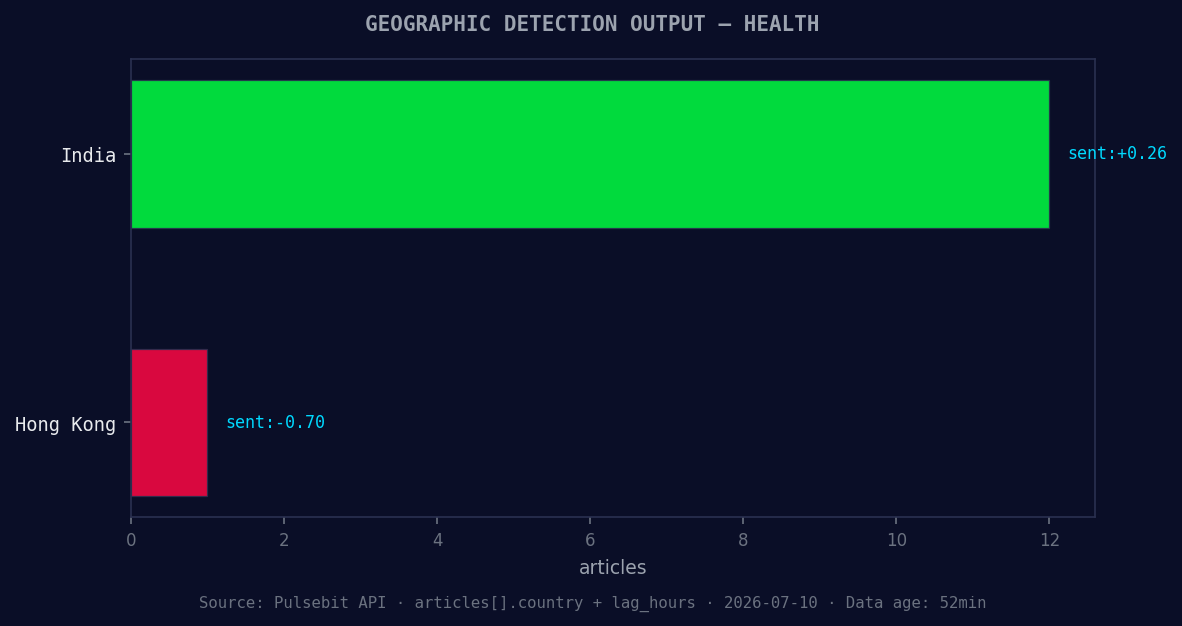
*Geographic detection output for health. India leads with 12 articles and sentiment +0.26. Source: Pulsebit /news_recent geographic fields.*
# Make the API call to fetch sentiment data
response = requests.get(url, params=params)
data = response.json()
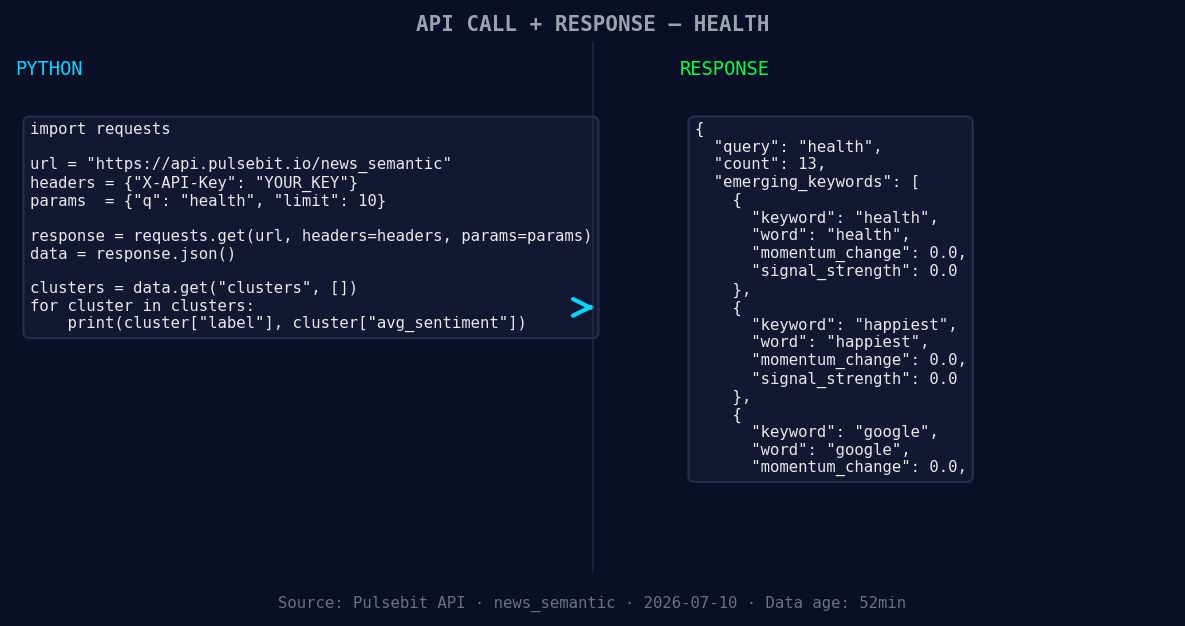
*Left: Python GET /news_semantic call for 'health'. Right: returned JSON response structure (clusters: 3). Source: Pulsebit /news_semantic.*
print(data) # This will show you the sentiment data
Next, we need to assess the narrative framing around this sentiment. We can run the cluster reason string back through our sentiment endpoint to score it:
# Define the narrative string
narrative_string = "Clustered by shared themes: healthy, aging, expert’s, favorite, social."

# Make a POST request to score the narrative
response_meta = requests.post(url, json={"text": narrative_string})
meta_data = response_meta.json()

print(meta_data)  # This will show the sentiment score of the narrative
With this setup, you’re not just relying on raw sentiment scores but also evaluating the context in which these sentiments are formed. It’s essential to understand how the narrative is framing these insights.
Now, let’s discuss three specific things you can build using this pattern. First, you can implement a signal check that triggers alerts when sentiment drops below a certain threshold, say below -0.500. This can help you stay ahead of any potential negative trends.
Second, leverage the geo filter to create localized sentiment dashboards that can help you understand variations in health sentiment across different regions, enhancing your overall strategy.
Lastly, use the meta-sentiment loop to build narrative analytics that can score and report on the framing of health discussions in media. For instance, track forming themes like health(+0.00), happiest(+0.00), and google(+0.00) against mainstream narratives like healthy, aging, and expert’s.
By identifying these elements, you can craft a more responsive model that adapts to shifts in sentiment before they become widespread.
If you want to dive deeper, check out our documentation at pulsebit.lojenterprise.com/docs. You can copy-paste and run this setup in under 10 minutes. With the right approach, you’ll be catching sentiment leads on health topics well before your competitors do.


Top comments (0)